IAN HELFRICH / SITE INDEXFind anything.
71 records

Ian Helfrich / Selected spatial work

Spatial economics
& 3D GIS

Investment geography, classified LiDAR and reconstructed terrain. Research and working models at the scale of a neighborhood, a region and a country.

Explore the 3D work National investment atlas

Econometrics · Network analysis · Point clouds · Terrain

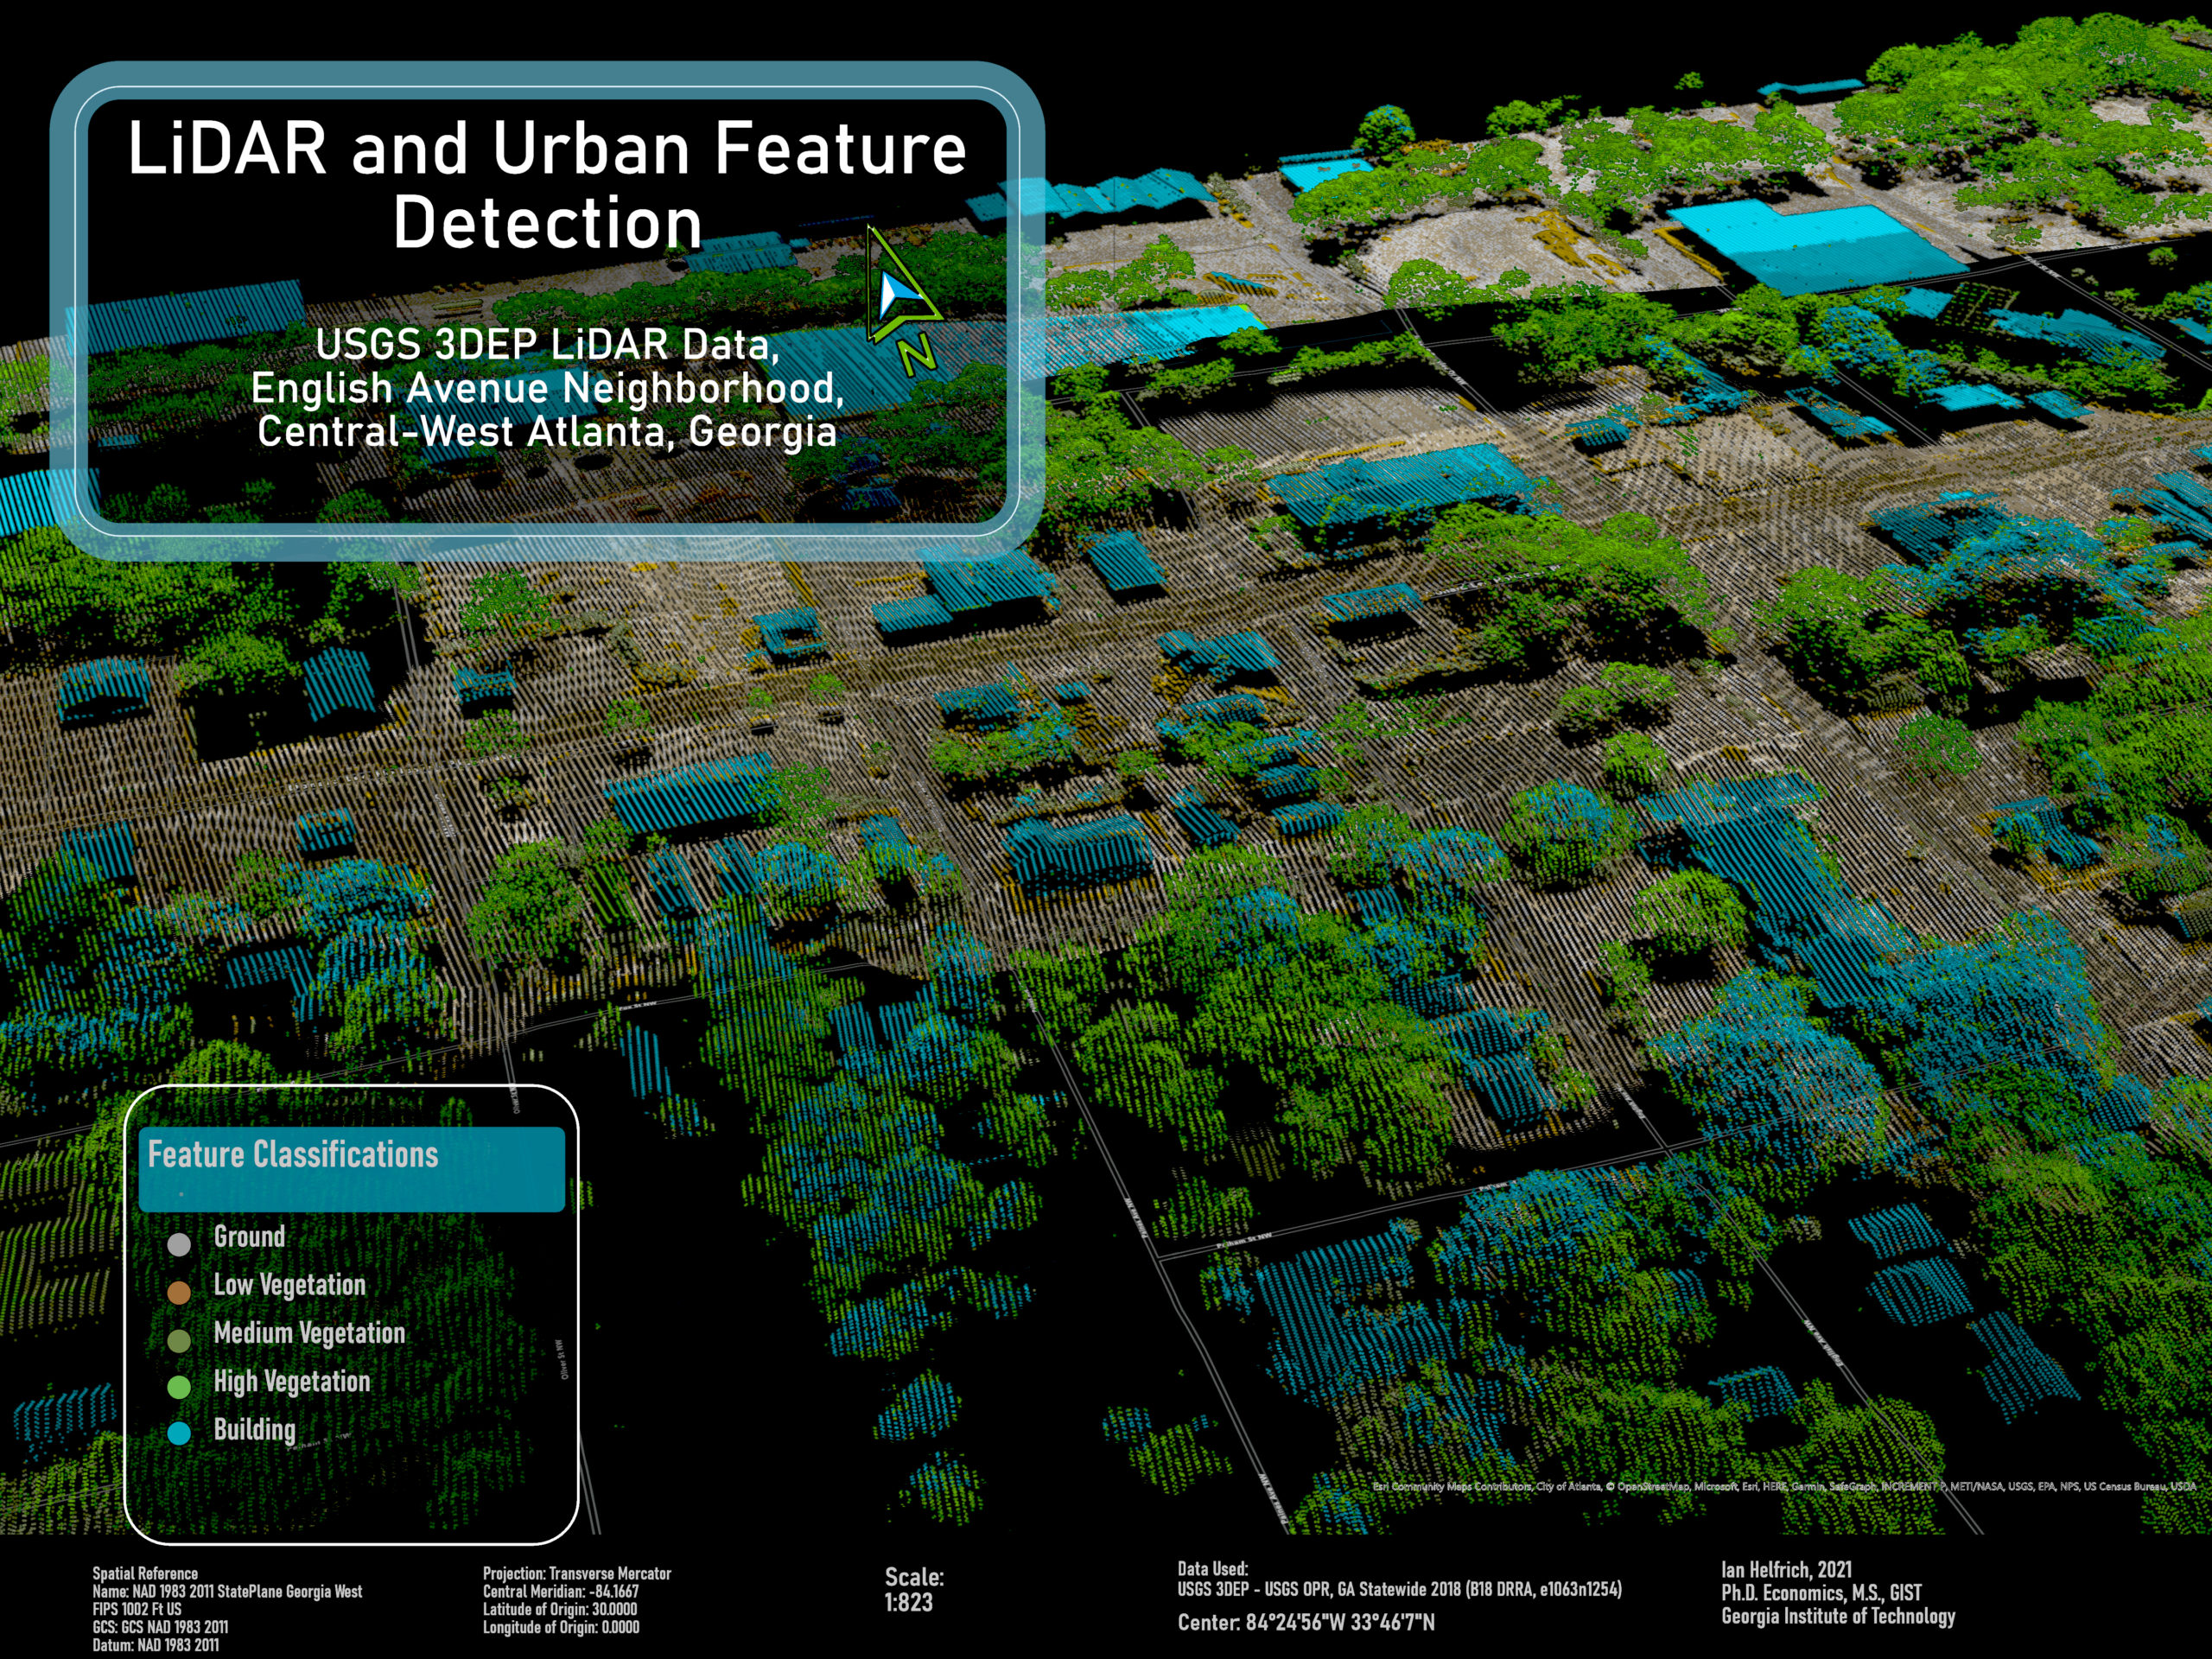
01 / Urban formAtlanta, Georgia
English Avenue · 10-second ArcGIS animationBuilding extrusions over aerial imagery · Academic work, 2021

Selected visual work

LiDAR, buildings & terrain

View all eight samples ↗

02 · Spatial investment

Investment incentives & regional geography

The national atlas reports where New Markets Tax Credit financing was observed. The Asheville scenario asks a separate, conditional question: how a fixed incentive budget changes road-network access to jobs once offers, additionality and relocation take stated values.

National NMTC financing atlas

Observed New Markets Tax Credit projects across the United States, built from the public CDFI Fund FY2025 release updated August 2026. Dollar totals are qualified low-income community investments (QLICI).

Limit. Financing records show where investment was observed. They do not measure jobs or outcomes, or what would have happened without the credit.

Open the national atlas

Spatial Investment Lab

A 3D scenario over Asheville terrain. It separates supported incentive offers from induced site employment and additional study-area jobs, then compares an equal split of the budget with an access-maximizing allocation across six existing employment clusters. Inputs are 2023 Census primary-job counts and a directed OpenStreetMap road network.

Limit. A conditional scenario, not a causal estimate. Behavioral parameters are illustrative; the model has no fiscal return, wage or general-equilibrium component.

Open the Asheville scenarioProject record

The NMTC rural mobilization gap

Compares rural and urban investment within the same Community Development Entity, using 19,907 transactions across 8,024 projects, with intermediary fixed effects and an order-invariant decomposition.

Limit. The paper uses an earlier data vintage than the national atlas and its estimates are not restated with the 2023 data. Its results are descriptive and noncausal.

Read the paper

03 · LiDAR and terrain

LiDAR diagnostics and reconstructed terrain

The portfolio holds eight selected artifacts, including academic exercises and group work that are credited as such. The terrain diagnostic and interactive mesh use different source measurements.

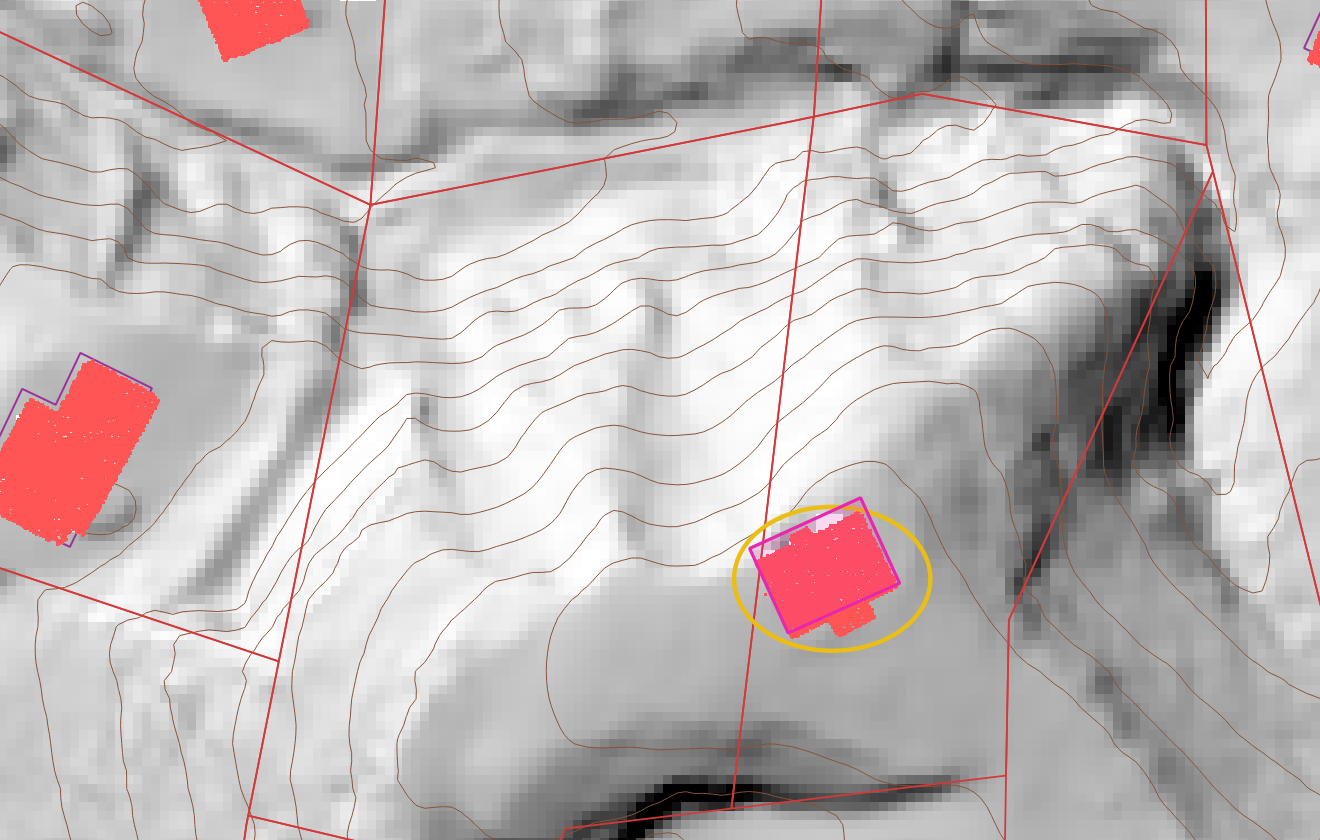
LiDAR-derived hillshade and contours with pink building returns, reference footprints and parcel lines on a North Carolina hillside; no address or coordinate labels.
Classified LiDAR returns · Henderson County, NC · 2026 analysisGround surface, hillshade, contours and building returns. Footprints and parcel lines are reference geometry, not surveyed positions. Acquisition date and survey accuracy were not established.

North Carolina terrain diagnostic

An independently processed ground-only surface was used to check a reported raster streak. The streak was absent from the comparison hillshade, which narrowed the diagnosis. Refining the grid could not recover ground returns that were not collected: missing cells rose as cells shrank.

Limit. Terrain diagnostics only. Rainfall, infiltration, discharge and calibrated flood depth are outside the analysis.

Read the diagnosticAll eight artifacts

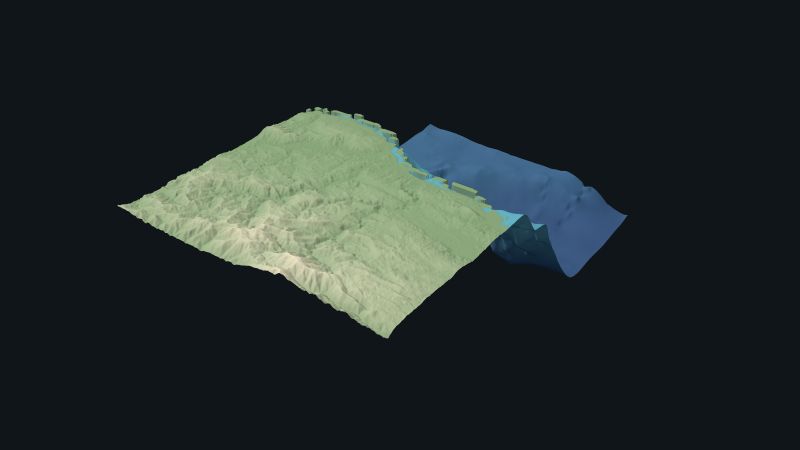
Southern Haiti coastal terrain mesh

An original triangulated surface joining land elevation and seabed bathymetry, loadable in the browser for rotation, wireframe and vertex inspection. Sources are GMRT bathymetry (CC BY 4.0) and Mapzen terrain tiles built from SRTM, GMTED2010 and ETOPO1.

Limit. The mesh vertices are gridded elevations, not LiDAR returns, photogrammetry or navigation data. A 100 m grid does not establish measurement accuracy.

Open the meshGeometry and provenance

04 · Applications

Geospatial applications

Urban property evidence, ocean dynamics and county-level spatial statistics.

  1. Application

    St. Louis City & Property Lab

    City and County geometry, official City property evidence and rental scenarios in a 3D city model. Scenario outputs remain separate from recorded parcel data.

  2. Ocean data · Live

    Hidden Rivers

    Depth-resolved HYCOM and NOAA current fields, Sentinel-2 water imagery and a 3D tank model with published numerical checks. The tank is a qualitative laminar model, not laboratory-calibrated.

  3. Spatial statistics · Live

    American Policy Atlas

    County-level spatial statistics, regression diagnostics, empirical-Bayes shrinkage and a California redlining case study. Associations remain distinct from causal effects.

    Open the atlas ↗

How to read the evidence
Observed records
Administrative financing records from the CDFI Fund. They describe what was reported, not what the financing caused.
Scenario model
Calculated output under stated assumptions. Asheville parameters are illustrative, not estimated.
LiDAR returns
Classified laser-return points, processed into ground, building and vegetation layers.
Gridded terrain
A mesh built from gridded elevation. Its vertices are not LiDAR returns.

05 · More work

Other spatial and quantitative work

Spatial analysis & technical instruction

Discuss a project

Tell me what you need to understand, visualize or build, and which data you have.

Get in touch ↗