Ian HelfrichPhD

Geographic information science / Selected work

LiDAR &
3D GIS.

Point clouds, reconstructed surfaces and the shape of places.

My work connects classified LiDAR, terrain reconstruction and 3D cartography with the questions behind a site: landform, building context, survey design and economic access.

Explore the work

Selected work

01–08 / LiDAR · Surfaces · Buildings · Analysis
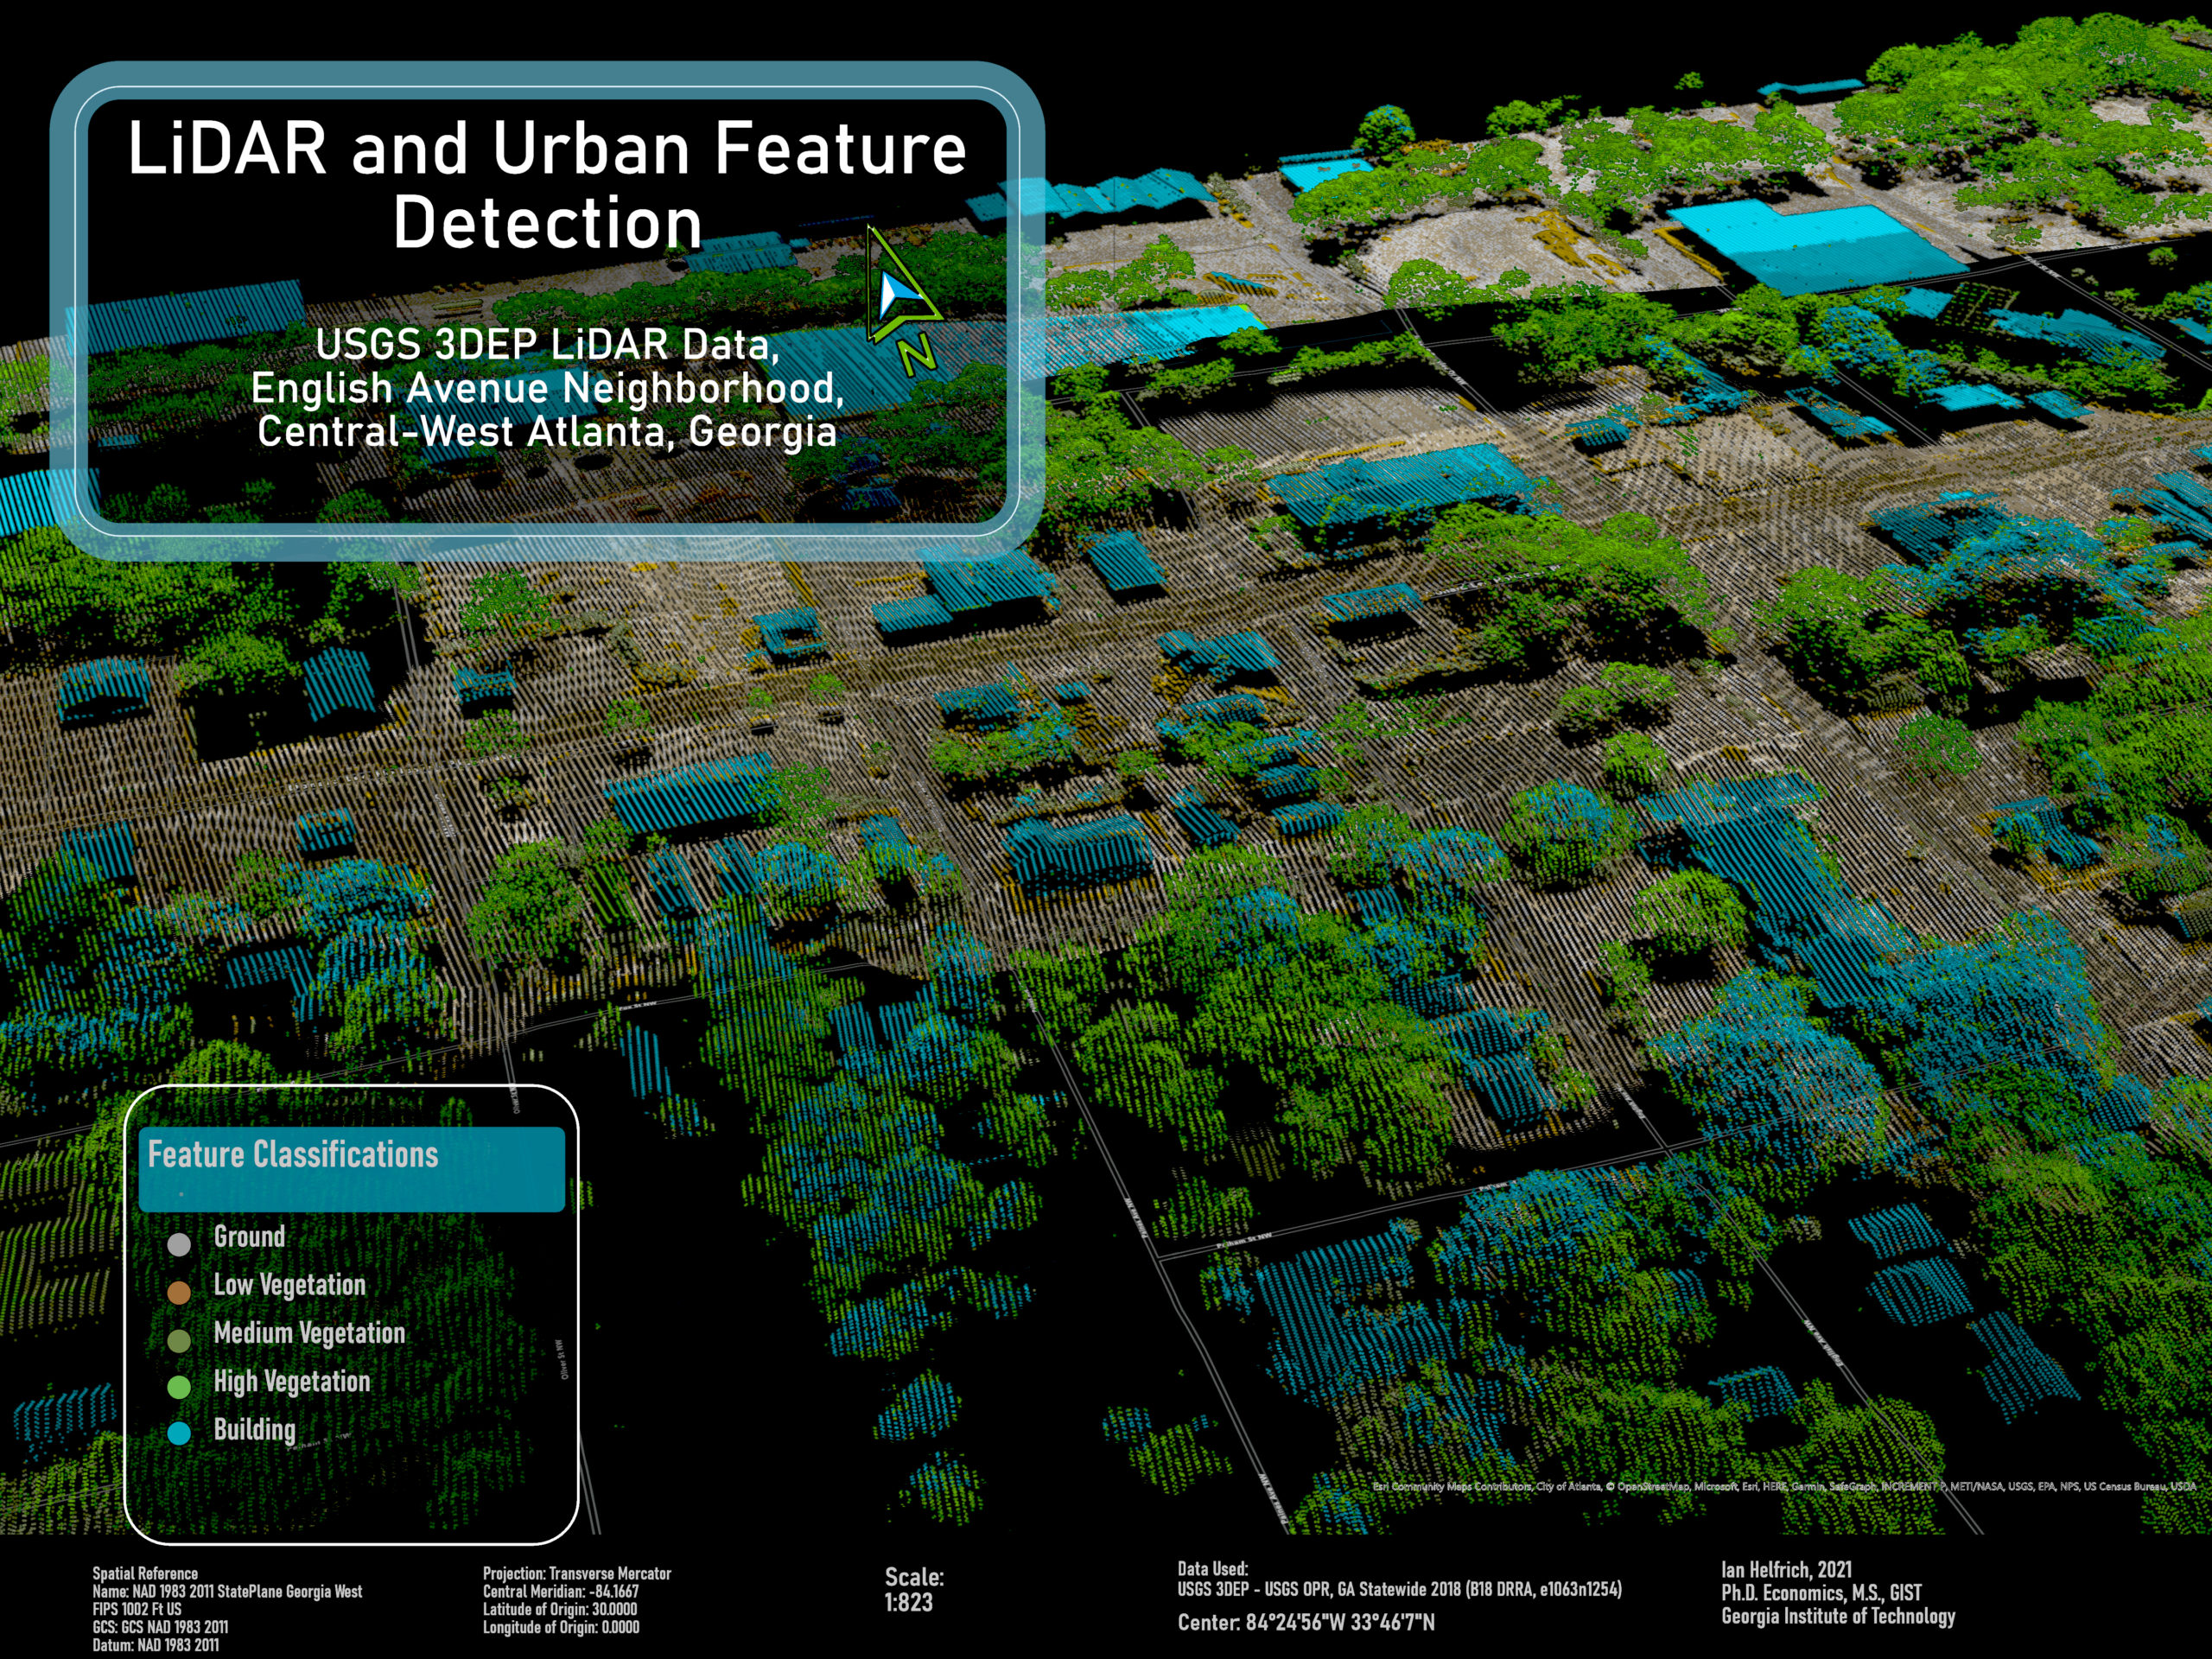
Oblique LiDAR point cloud of English Avenue, with cyan buildings, green vegetation and gray ground.
Point-cloud classification · 3D cartography

Atlanta, Georgia · 2021

English Avenue, in three dimensions

Classified elevation returns reveal buildings, tree cover and ground beneath the urban scene. This map combines USGS 3DEP LiDAR with geographic context for Atlanta’s English Avenue neighborhood.

Open full-resolution image

Ian Helfrich · Georgia Tech academic work. USGS 3DEP; additional map credits retained in the image.

Reconstructing Haiti’s coastal terrain

Original surface / Interactive 3D

Land elevation and seabed bathymetry meet in a continuous triangulated surface. This excerpt from my Haiti terrain workflow retains 525,474 triangles, with elevation shading that exposes the shelf, slopes and mountain relief.

10.5 MB, loaded on demand. Rotate, zoom and inspect the underlying mesh.

100 m mesh sampling; original vertical exaggeration: land 1.2×, seabed 6×. Reconstructed from gridded elevations, not photogrammetry. The original mesh is clipped to exclude its zero-filled outer boundary, then transformed to a local coordinate frame; source imagery is replaced with elevation shading. Grid spacing does not establish measurement accuracy.

Bathymetry: Global Multi-Resolution Topography Synthesis (GMRT), CC BY 4.0; Ryan et al. (2009), doi:10.1029/2008GC002332; data DOI. Land: Mapzen Terrain Tiles / AWS; SRTM and GMTED2010 courtesy of USGS; ETOPO1 courtesy of NOAA. Not for navigation. Geometry & provenance.

The analysis behind the geography

Research & applied methods

North Carolina / Terrain & drainage

Checking what the terrain can support

A reconstructed ground surface made it possible to compare a reported raster streak against independently processed LiDAR. The streak was absent in the comparison hillshade; that narrowed the diagnosis without claiming to identify the original processing fault.

Resolution sensitivity mattered: missing cells within the inspected building footprint rose from 38.6% at 3-foot cells to 77.1% at 1-foot cells and 87.5% at half-foot cells, with search radii reduced alongside cell size. A finer grid could not recover ground returns that were not there.

The related site-assessment workflow adds slope, depression storage and D8 contributing-area screening. Those are terrain diagnostics. Rainfall, infiltration, discharge and calibrated flood depth are outside that model.

Archived September 2026 diagnostics. Black areas in the hillshade retain missing ground data. The related USGS terrain source is from the 2018 NC Phase 5 survey and predates Hurricane Helene; this does not establish the acquisition date of the separately supplied LAS.
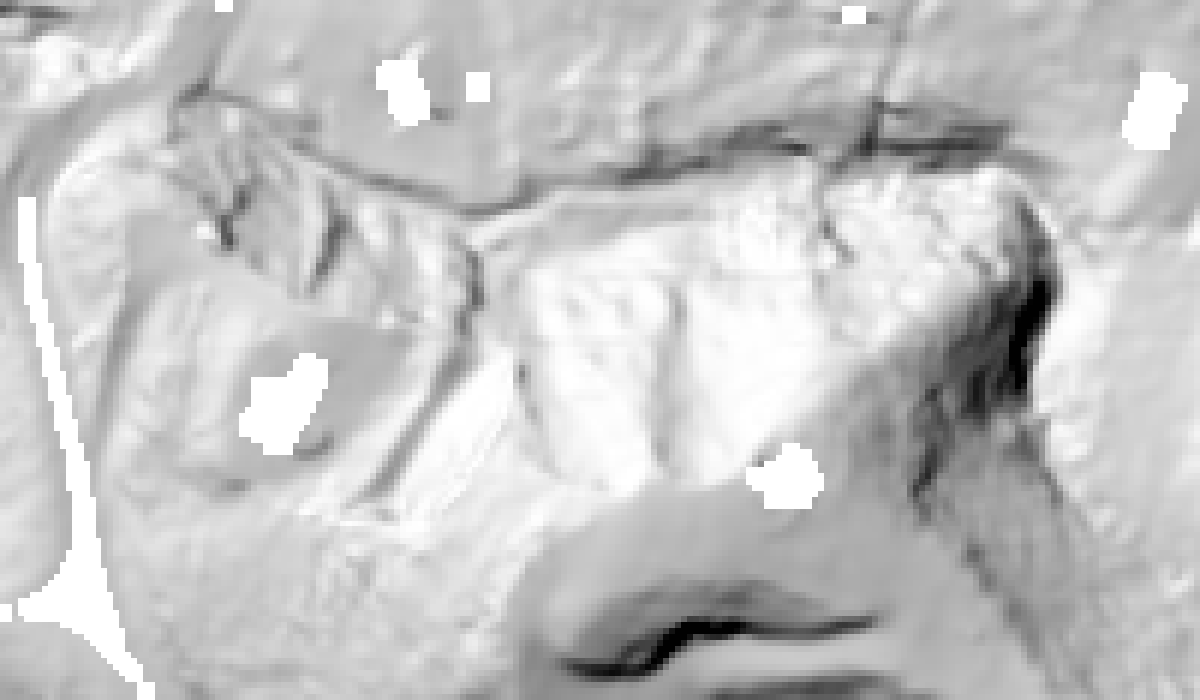
Independent ground-only hillshade of the inspected hillside, preserving black gaps where ground data are missing.
Ground-only reconstruction used to check the reported raster artifact. Open the image to inspect it.

Place-based investment / Working paper

The rural mobilization gap

Does a rural–urban investment gap remain when projects are compared within the same Community Development Entity? I built a panel from 19,907 transactions covering 8,024 projects and examined the gap with intermediary fixed effects and an order-invariant decomposition.

The mean within-intermediary estimate is −0.047, with a 95% interval from −0.245 to +0.152. The estimates do not establish a causal mechanism or rule out a meaningful within-intermediary component.

Read the working paper

Ian Helfrich · Sole author. Contributors acknowledged on the research page. Public CDFI Fund data; descriptive, noncausal analysis.

Remote sensing / Trade / Preprint

Trade in the spotlight

Country-to-country distance depends on where people and economic activity are located. With Elizaveta Gonchar, I studied gravity-model distance measures built from VIIRS nightlights and gridded population, using weighted centroids as the endpoints of geodesic distance.

The 2025 preprint connects satellite data processing to an economic measurement problem. A proposed time-varying transport-network extension remains separate work in development.

Explore the preprint

Elizaveta Gonchar & Ian Helfrich · April 2025 preprint. No completed panel or transport-network extension is claimed.

Explore the geographic setting in 3D

Cesium ion / Regional context

Rotate and zoom through terrain, aerial imagery and available OSM buildings. This regional context is separate from the source LiDAR, survey designs and analytical results above.

Load on demand. Source attribution remains visible in the 3D view.

Interactive geographic tools

Explore in the browser

Investment incentives / Regional growth

Spatial Investment Lab

Compare investment locations over Asheville’s 3D terrain. Allocate a fixed budget, separate incentive offers from additional jobs, and inspect road-network access by earnings group.

Open investment lab
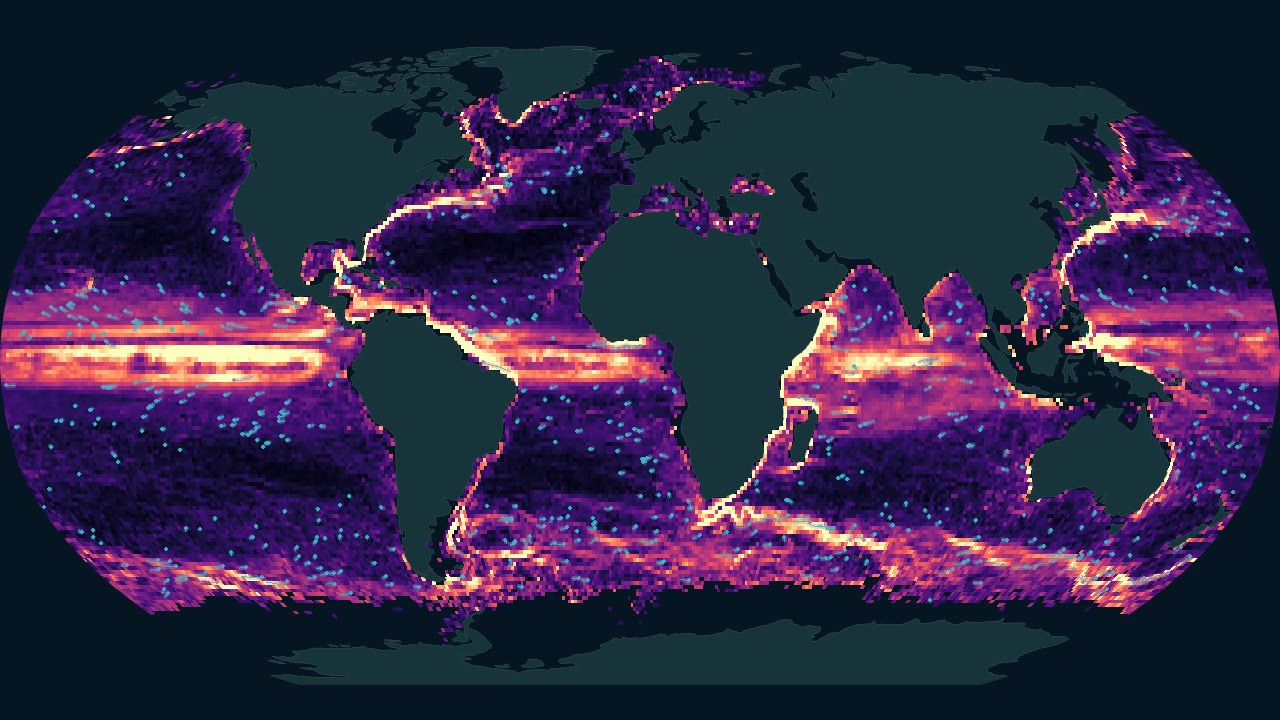
Global ocean-current visualization showing the structure of circulation across ocean basins.Open interactive globe ↗

Ocean & remote sensing

Hidden Rivers

Explore ocean currents, Amazon waters and coastal scenes through a geographic globe, satellite imagery and depth views. Compare places, inspect the data and change the view.

Launch Hidden Rivers

Sources include Sentinel-2, HydroRIVERS, HYCOM and NOAA drifter climatology. Source dates and model distinctions accompany the views.

Urban geography & property

St. Louis City & Property Lab

Explore mapped buildings and streets alongside parcel and zoning information. Building heights and property scenarios retain their source and assumption distinctions.

Open the city lab

Spatial statistics & public policy

American Policy Atlas

Move from county-level maps to spatial autocorrelation, regression and empirical-Bayes shrinkage. A California redlining case study connects historical geography with present-day outcomes while keeping association distinct from causation.

Open the policy atlas

Work with me

Have a spatial question?

I work on geographic analysis, research visualization and technical instruction. Share the question you need to answer and the data you have.

Discuss your project
English Avenue, in three dimensions
1 / 8