9 Lying with charts
- Five common visual lies and how to recognize them
- Why bar charts should almost always start at zero
- The honest defaults that prevent these errors
- Tufte’s lie factor and how to compute it on a chart in the wild
9.1 A defensive reading skill
This is a different kind of chapter. The previous chapters built up the visual vocabulary the book uses. This one teaches you to read other people’s charts critically, because most charts you encounter outside of textbooks are made by people with an argument they want to win, and a well-made chart is a powerful tool for winning arguments dishonestly.
The techniques below are not separate problems. They are the same problem (a mismatch between visual encoding and the truth of the underlying data) applied to different aesthetics. Truncated y-axes lie about position. Cherry-picked windows lie about what is in scope. Area encodings lie when length is what is being compared. Dual axes lie about what corresponds to what. Log scales lie about effect sizes. Each one will fool you the first time you see it. Once you can name the trick, you stop being fooled.
The chapter ends with a short list of honest defaults that prevent most of these errors when you make charts of your own. Read them last.
9.2 The truncated y-axis
The most common visual lie. A bar chart shows that quantity X went from 100 to 102, but the y-axis starts at 99 and ends at 103. Visually, the second bar looks much taller than the first: maybe four times taller. Numerically, X grew by 2%.
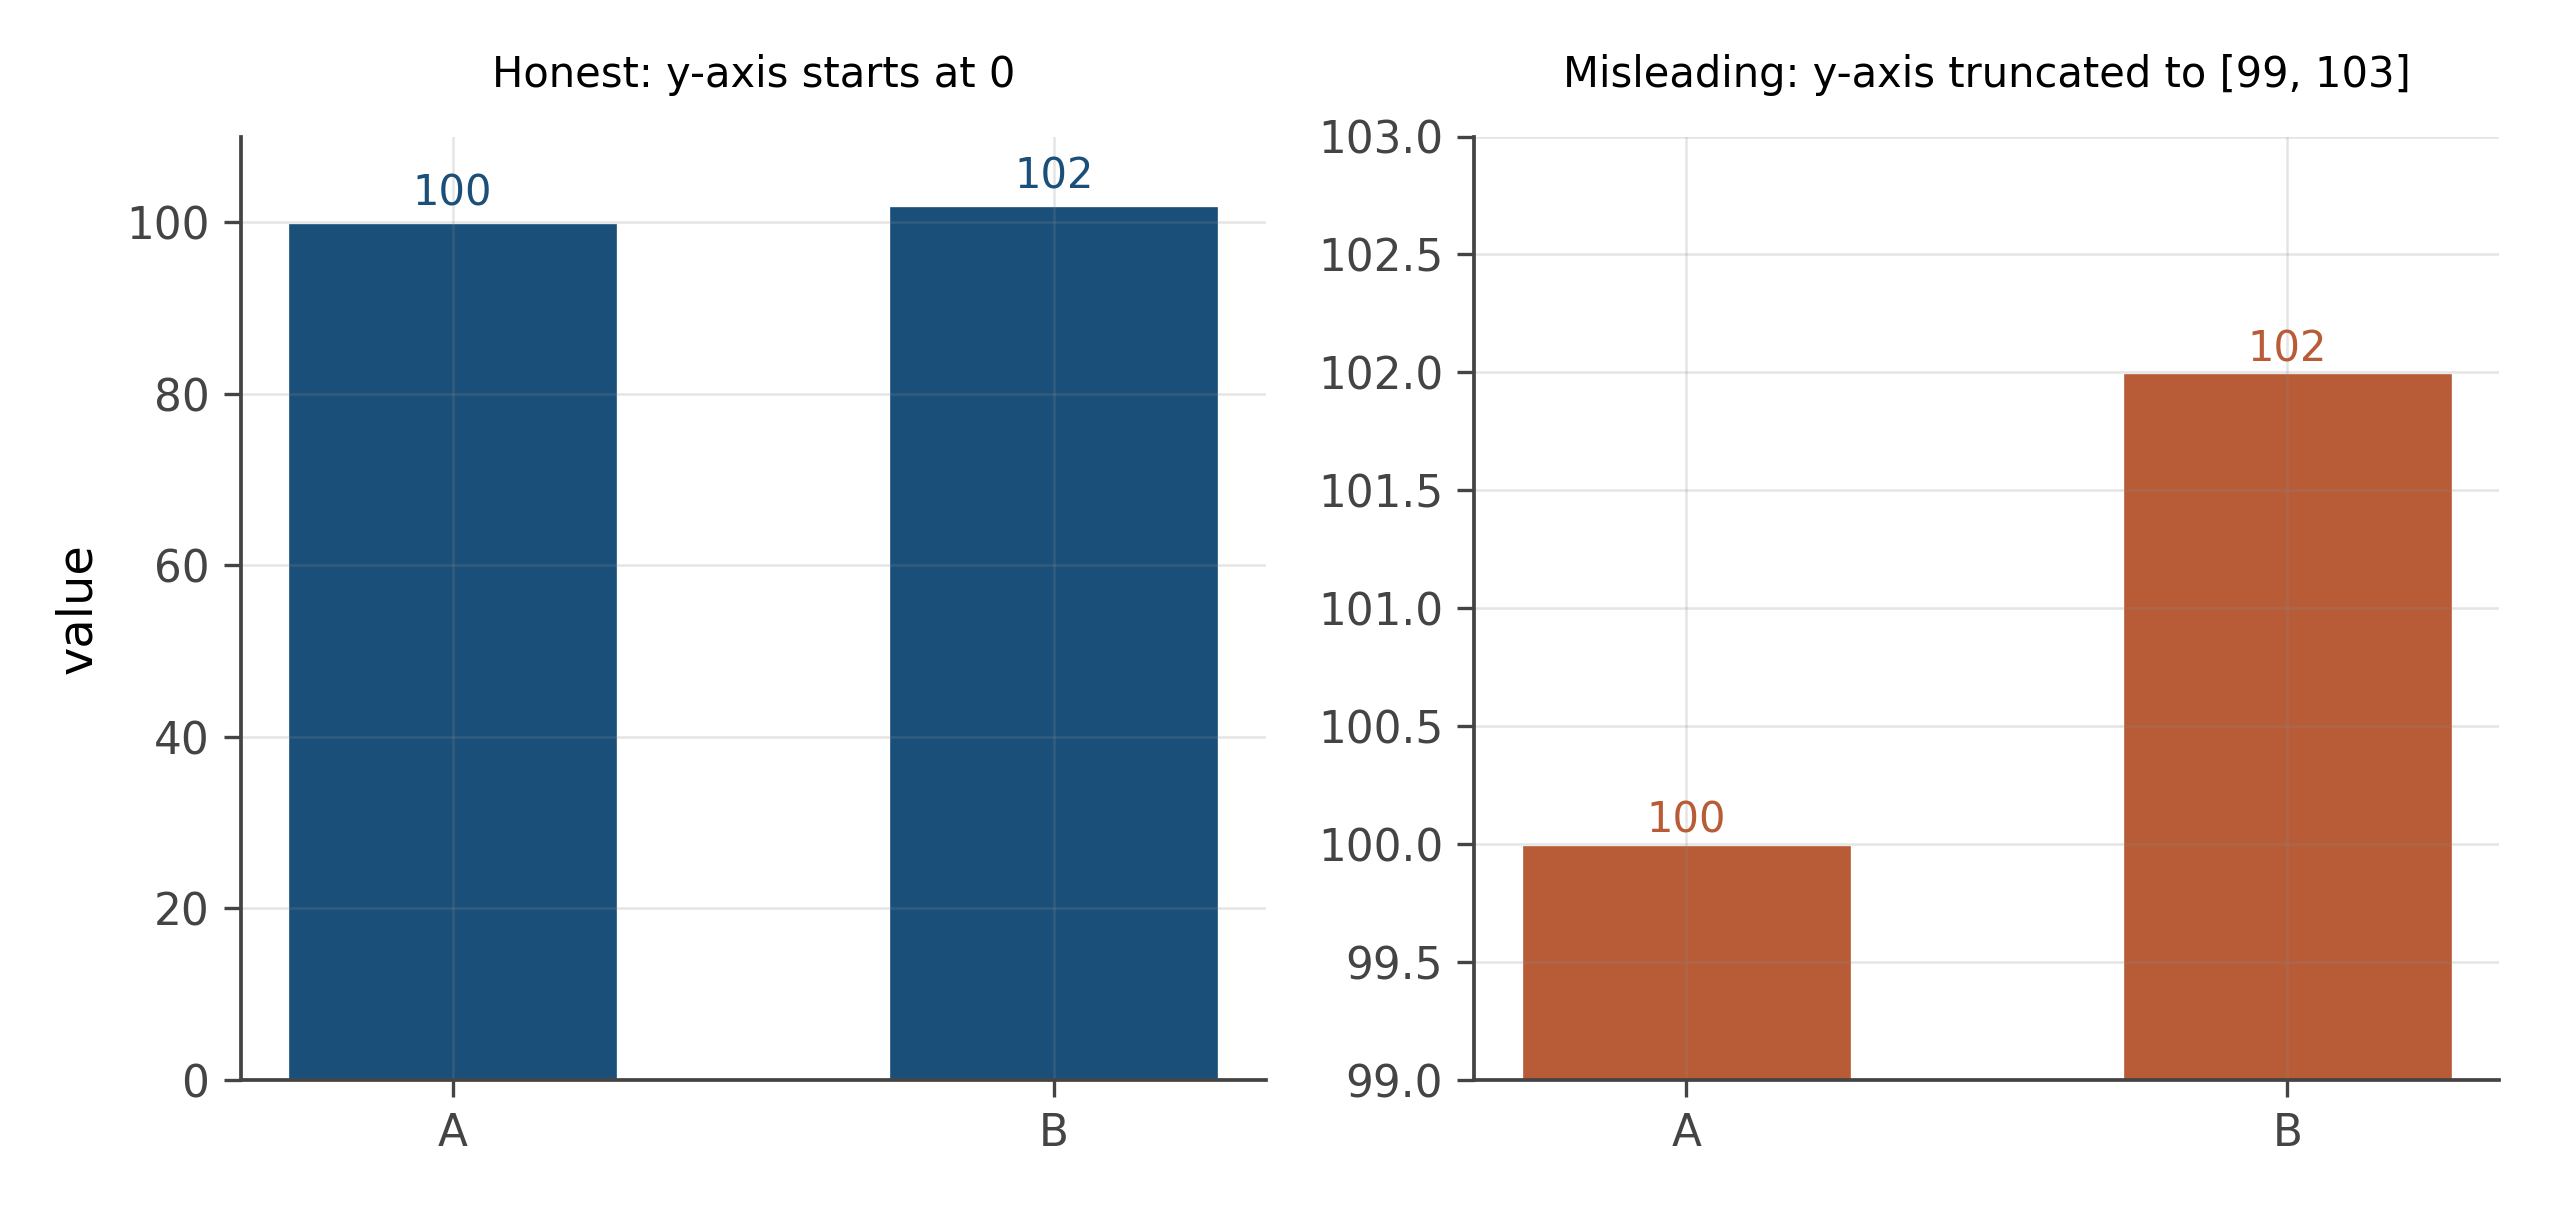
The defensive move: always check where the y-axis starts. If it does not start at zero on a bar chart of magnitudes, the chart is amplifying or muting differences relative to a chart that does start at zero. Sometimes that amplification is editorially fine (small changes in CPI matter; you would not want to start at zero for a chart of historical CPI, because zero CPI is a meaningless reference). More often it is dishonest.
A useful rule. Bar charts should almost always start at zero, because the visual story of a bar chart is “compare the heights.” Line charts are different. Line charts about percentage changes or rates can legitimately start anywhere, because the visual story is about changes over time, not absolute heights. Be especially suspicious of bars that do not start at zero.
9.3 Cherry-picked time windows
The same time series can tell completely different stories depending on which part of it you show. Pick a starting point near a peak and you get a downward trend. Pick a starting point near a trough and you get an upward one. Both are honest in the sense that the data shown is real. Both are dishonest in the sense that the choice of window is the editorial argument, and a chart that does not show the longer context is hiding the argument behind a curated frame.
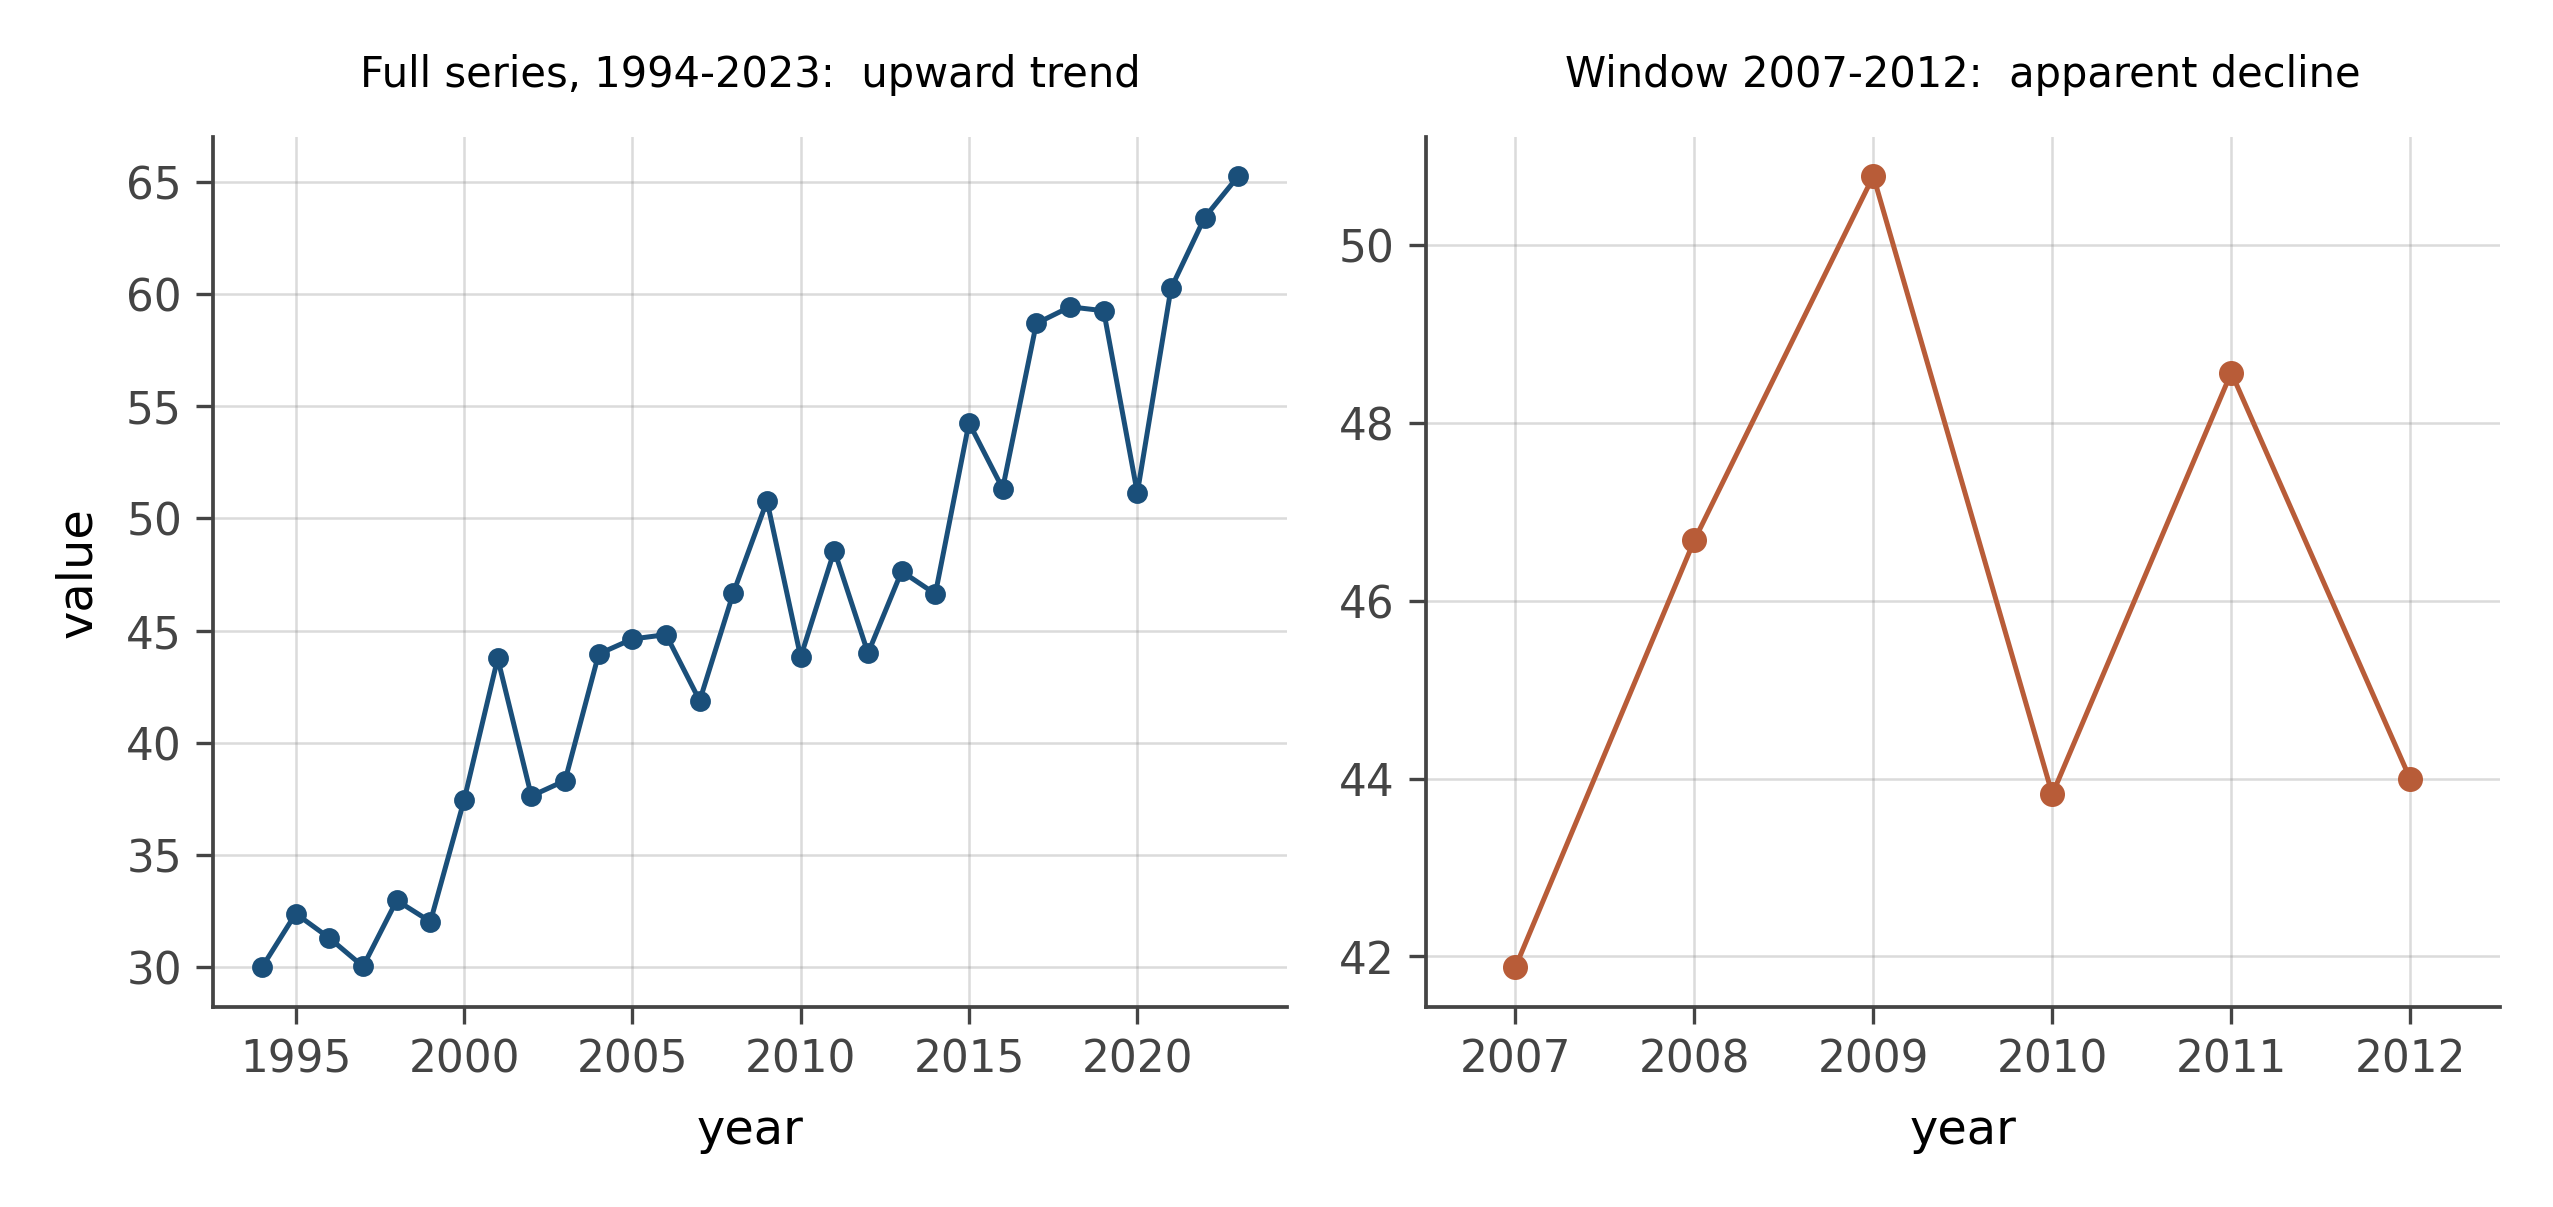
The defensive move: ask why this window. If the chart shows five years and you suspect more data exists, look for it. If the chart starts at a suspiciously specific date, check what was happening just before. Markets, climate series, public-health metrics, all of these have natural reference points (a peak, a recession, a prior policy change) that are deliberately included or excluded to shape the story.
9.4 Area when length was needed
A bar twice as tall has twice the height. A circle twice the diameter has four times the area. A sphere twice the diameter has eight times the volume. When a chart encodes a quantity as the area of a circle (a “bubble chart” or “infographic”) or as the volume of a 3D shape, the visual sense of magnitude grows faster than the underlying number, and the reader systematically overestimates differences.
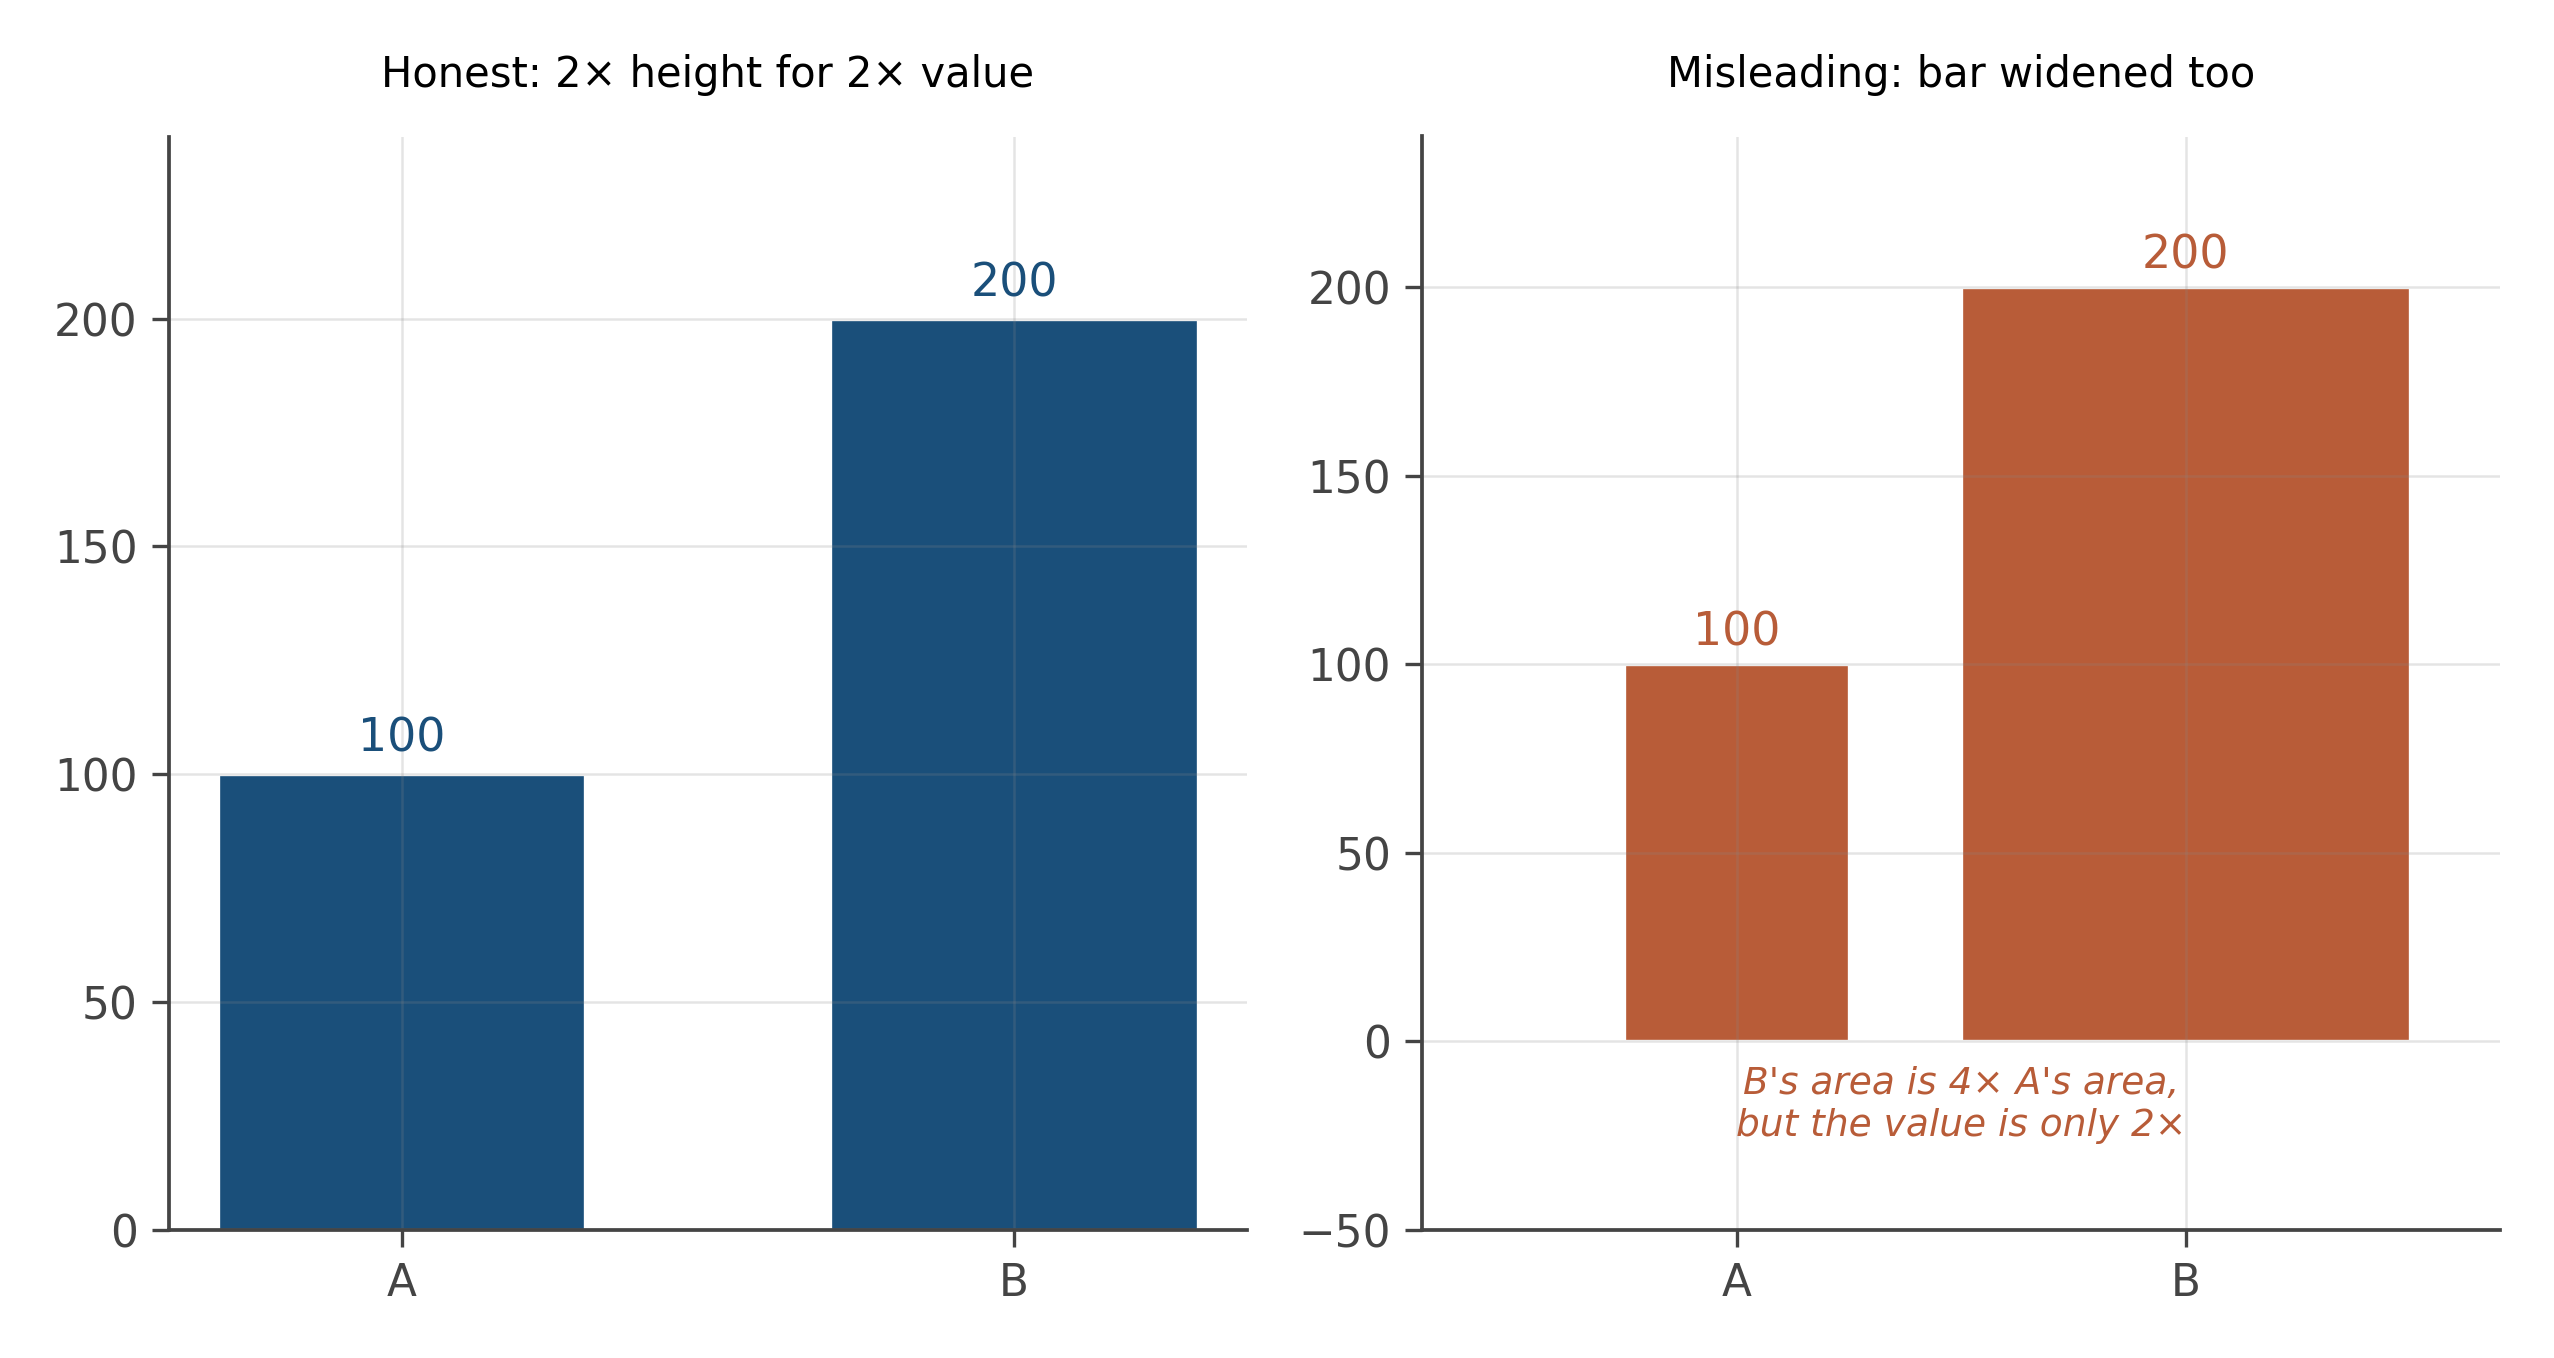
This goes wrong in two ways in the wild. One is genuine area encoding (“this circle represents 100 million people; this circle, twice as large in area, represents 200 million”). The reader’s eye does not weigh area linearly, so the “twice as large” judgment is unreliable. The other is unintended area encoding: a bar chart where the bars get wider as well as taller, or a 3D bar chart where perspective makes the back bars look different from the front ones at the same height. Both are common in business presentations.
The defensive move: when you see area or volume as an encoding, do the calculation. The 2x circle has 4x the area; ask whether the underlying number is 2x or 4x.
9.5 Dual-axis chicanery
Two time series on the same chart, with two y-axes, one on each side. Each axis is scaled differently. The two series appear to track each other beautifully, suggesting a relationship.
The trick is in the axis scaling. The author has chosen the two axis ranges to make the curves overlap. Different ranges would produce no apparent relationship. The eye, however, reads “they are tracking each other” with no awareness that the relationship is an artifact of axis choice.
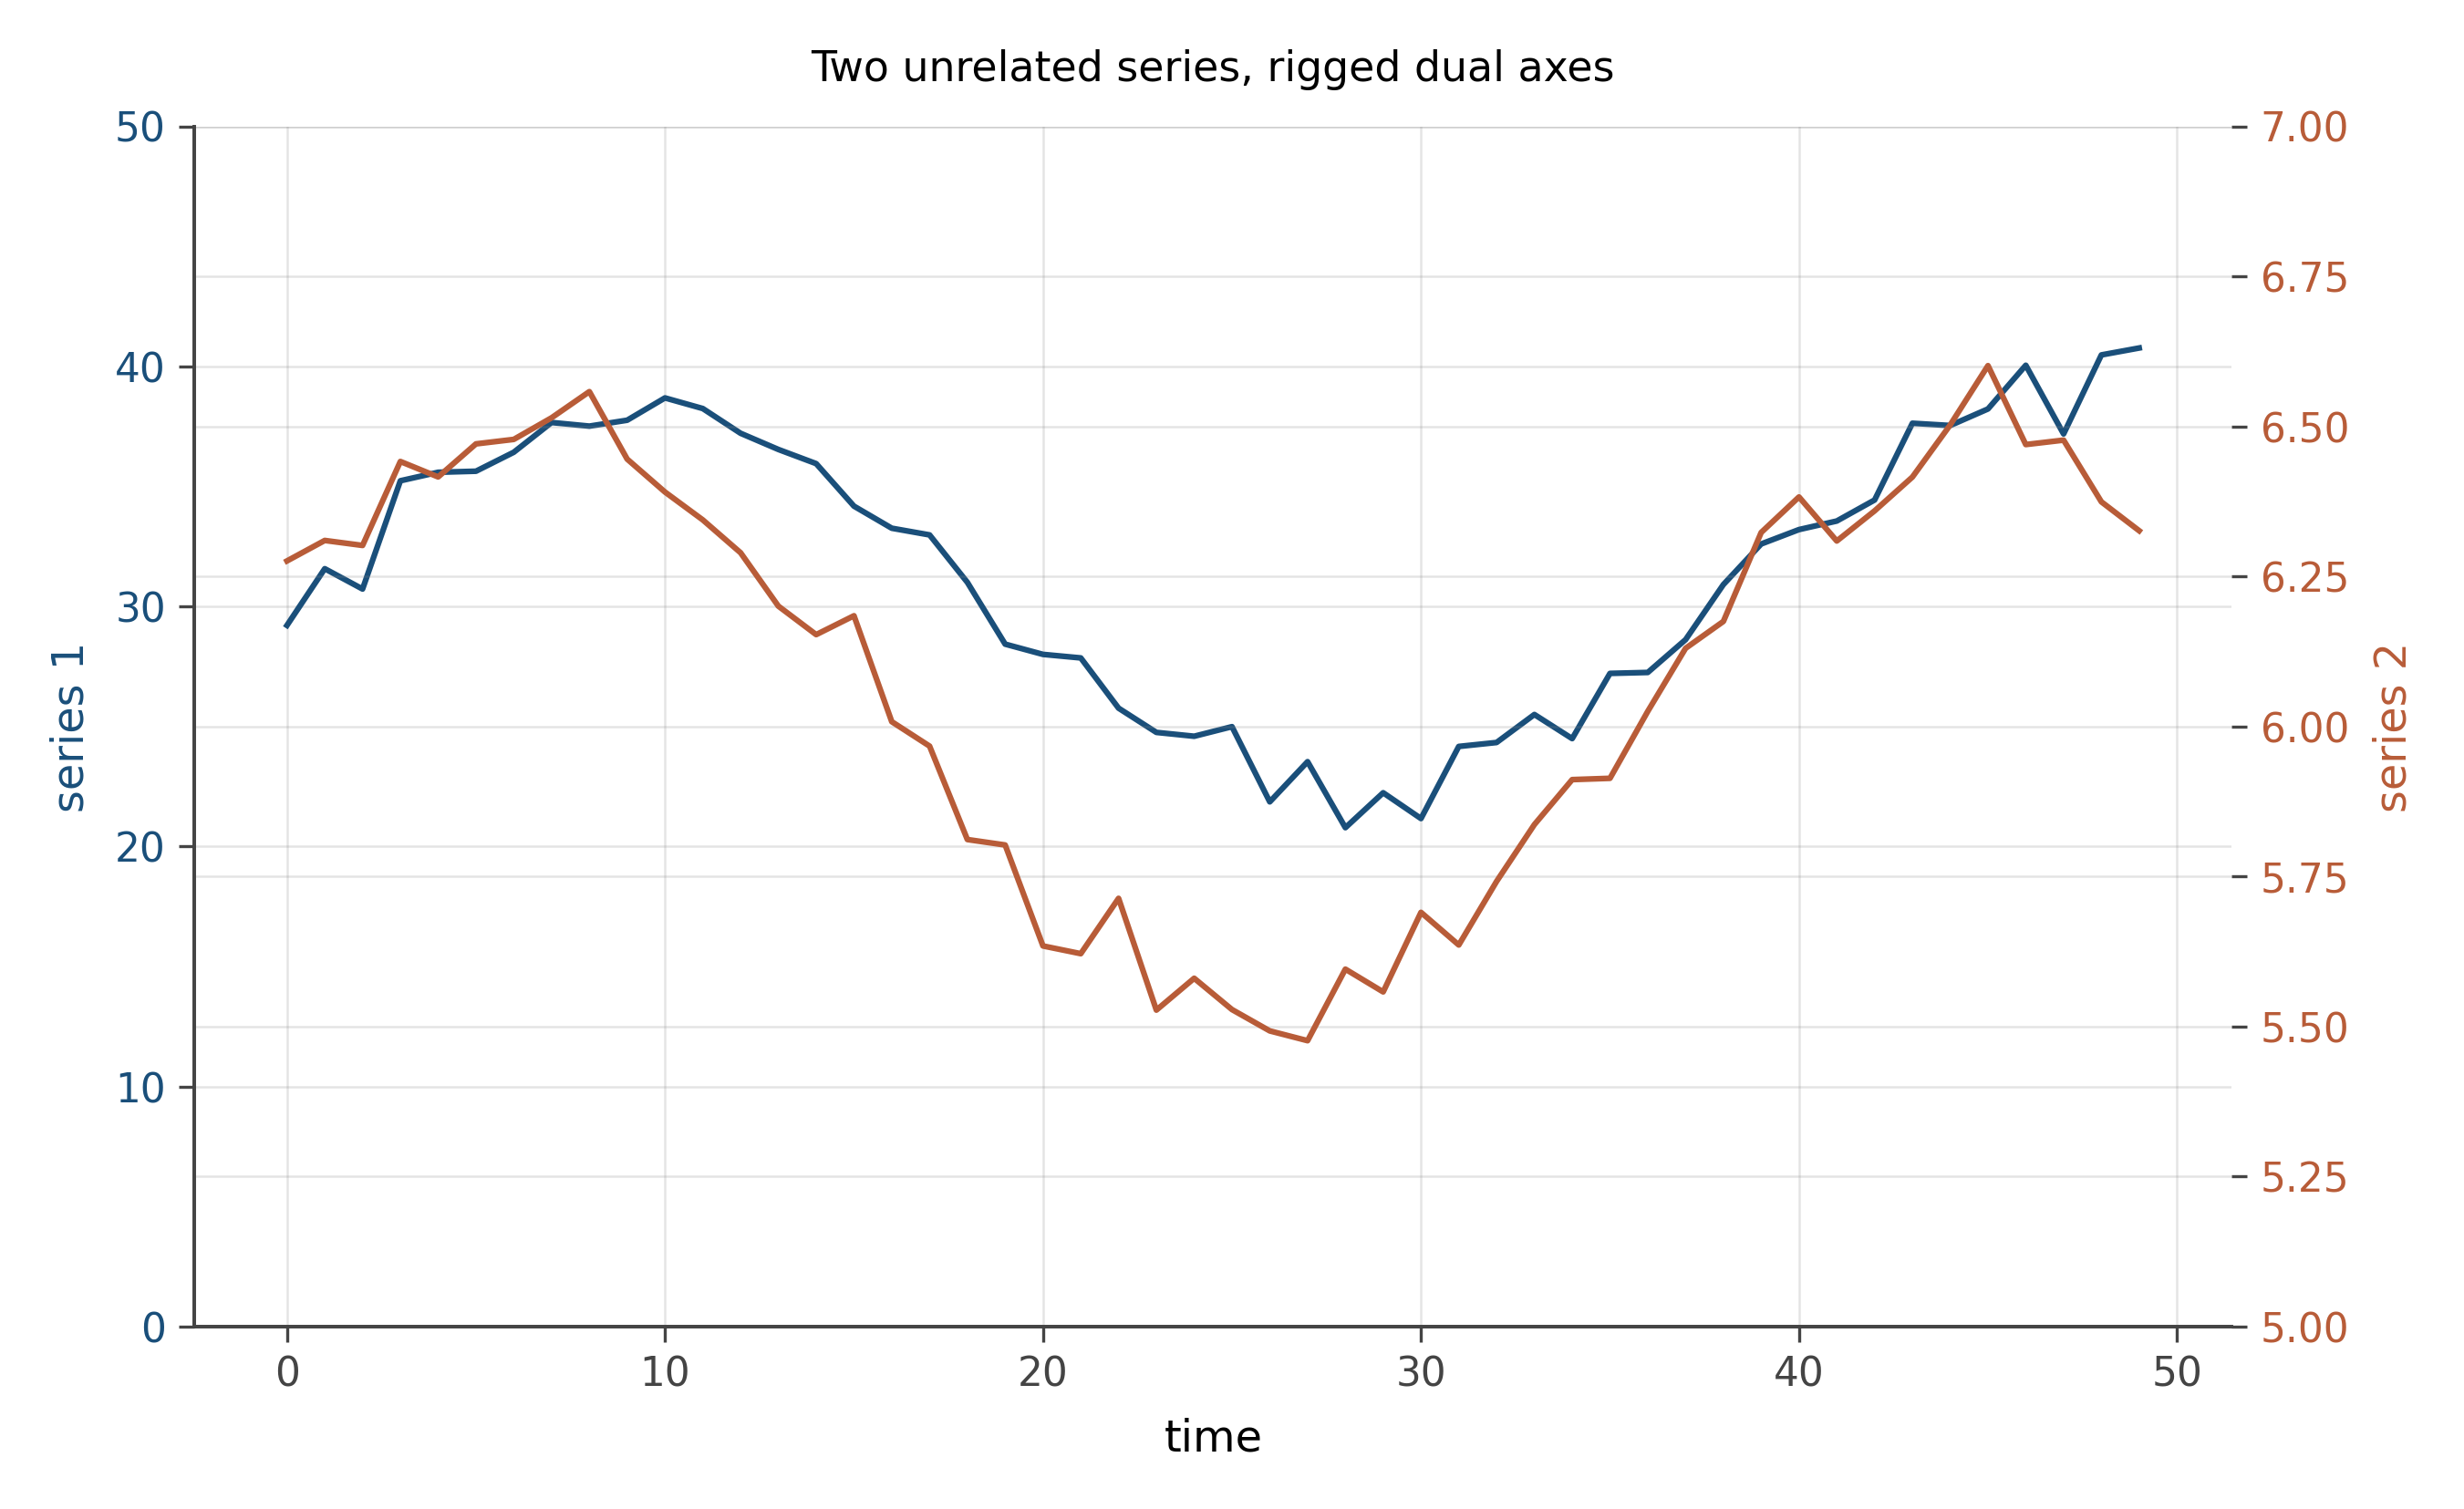
Dual-axis charts are not always dishonest. Sometimes the author genuinely wants to show two related quantities measured in different units (temperature and humidity, say). But the burden of proof should fall on the author. If the two series are conceptually unrelated, dual axes will manufacture an apparent correlation that does not exist.
The defensive move: separate the two series into two stacked panels with their own axes. The relationship, if real, will still be visible. The relationship, if manufactured by axis manipulation, will dissolve.
9.6 Log scales that hide effect sizes
The previous tricks amplify small effects. Log scales mute large ones. A series that grows from 1 to 1,000 takes a giant vertical step on a linear scale and a small one on a log scale. On the log scale, the growth from 1 to 10 looks the same as the growth from 100 to 1,000, even though both represent tenfold increases. The constant log-step is good for showing rates of growth, but it can be used to make explosive growth look gentle.
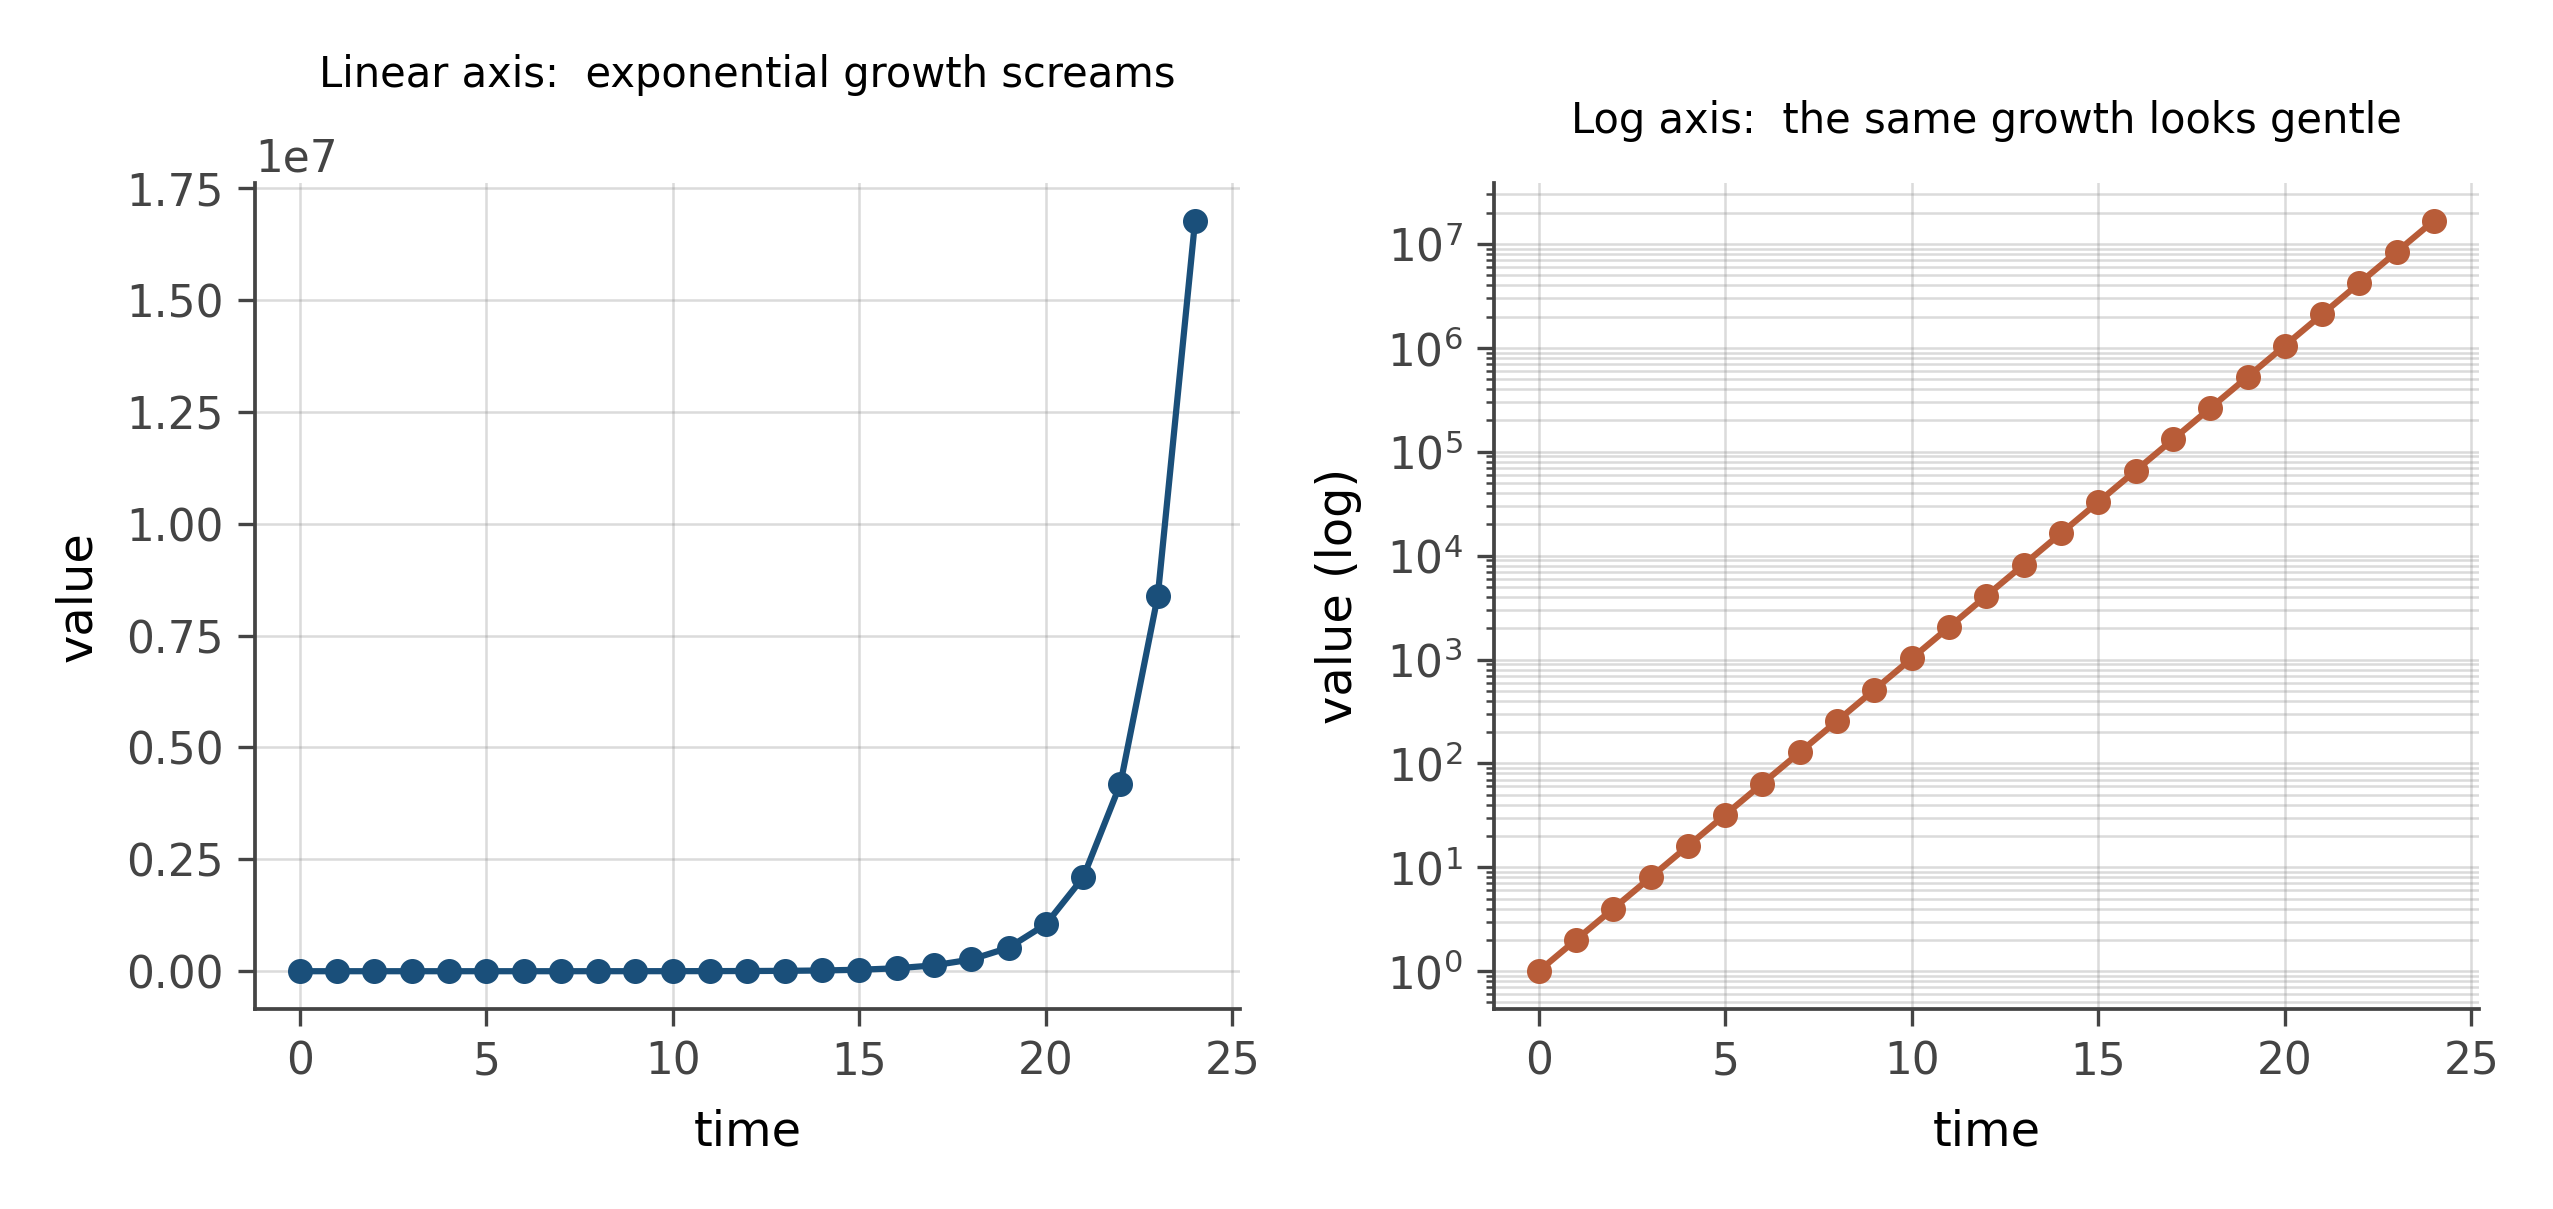
A common honest use: financial returns over decades, where the eye-relevant quantity is the percentage change, not the dollar level. A common dishonest use: showing a runaway quantity on a log scale and pointing to its “modest growth,” when the underlying number has gone up by several orders of magnitude.
The defensive move: when you see a log axis, mentally re-render the data on a linear axis. If the linear version would show an alarming surge, the log scale was muting an honest signal.
9.7 The honest defaults
Five rules that prevent most of the lies above when you are the one making the chart.
Bars start at zero. Line charts can start anywhere if the reader is told. Time-series windows include the most relevant context, not just the part that supports the argument. Quantities are encoded as length or position, not as area or volume, unless the question is genuinely about area or volume. Two unrelated series live in two stacked panels, not on dual axes. Log scales are used when growth rate is the question, and never when the level is.
That is the entire defensive checklist. Apply it to every chart in the news this week. You will be surprised how many fail.
Every visual lie in this chapter is the same kind of lie: a mismatch between the visual encoding and the underlying number. Position lies (truncated axes), scope lies (cherry-picked windows), area lies (bubble charts), correspondence lies (dual axes), and rate-vs-level lies (log scales). Five tricks. Once named, they stop fooling you.
Find a chart in a recent news article that you have an opinion about (politically, economically, scientifically, whatever). Apply the five-trick checklist. Does the chart truncate the y-axis? Cherry-pick a window? Use area when length would have done? Stack two unrelated series on dual axes? Use a log scale to hide a level?
Now do the harder version: find a chart in a recent paper from a journal you respect. Apply the same checklist. Find at least one thing the chart could be doing better. Many published charts do not pass the checklist; the journal-name does not absolve them.
The exercise is not about catching dishonesty (most authors are not malicious). It is about training your eye to notice when a visual is doing rhetorical work that the underlying data does not support.
Stevens’ law, from psychophysics, says that the perceived intensity of a stimulus follows a power law: S = k \cdot I^a, where I is the physical intensity and a is an exponent that depends on the stimulus type. For length, a is approximately 1.0 (the eye reads length almost linearly). For area, a is approximately 0.7 (the eye underestimates large areas relative to small ones). For volume, a is around 0.6.
The implication: when you encode a quantity as area, the reader systematically misjudges large values. A circle that is 4x larger in area is judged to be only 4^{0.7} \approx 2.6 times larger by eye. The number is right; the perception is wrong.
This is the deep reason area-based charts fail at precise comparison, and it is why position and length (where the eye reads linearly) sit at the top of the perceptual hierarchy. The hierarchy is not a stylistic preference; it is a description of human perception, derived from controlled experiments going back to Cleveland and McGill in the 1980s and Stevens in the 1950s.
A growing literature studies visualization deception as a research topic. Pandey and others (2015) showed experimentally that truncated axes, area encodings, and cherry-picked windows shift readers’ beliefs about underlying data, even when the readers know the chart might be biased. The effect persists for trained scientists.
The policy response, in some venues, is the requirement of open data and open code alongside any chart in a published paper. If readers can re-render the data themselves with honest defaults, the editorial freedom to mislead is sharply reduced. Journals like AEA: Applied Economics and the broader open-science movement have moved in this direction. The book’s worldview, if you have not noticed, is sympathetic to it.
For a longer treatment of this material, see Tufte’s The Visual Display of Quantitative Information (1983), which remains the standard reference. Tufte’s “lie factor” formalizes the area distortion in this chapter into a single number you can compute for any chart.
9.8 Practice problems
Find one chart in a news article from this week. Apply the five-trick checklist. What does the chart do well? What does it hide?
Tufte defined the lie factor as the ratio of the visual size of a change to the actual size. Compute it for a chart you find in the wild.
When is it legitimate to truncate a y-axis? Give two examples and explain what makes them legitimate.
Two unrelated time series look correlated on a dual-axis chart. Sketch the same data on stacked panels with separate axes. What changes?
A log scale is honest when growth rate is the question and dishonest when level is. Find one example of each in current news and defend your call.
- Which of the five tricks have you accidentally used in a chart of your own?
- The chapter argues that most visual lies are mismatches between encoding and data. Can you think of a sixth kind of mismatch that was not named?
- What is the strongest argument for a misleading chart? When (if ever) is editorial framing legitimate?
Looking ahead
Chapter 7: Underused visualizations. Once you can read defensively, you can also reach for chart types the standard intro repertoire skips. The next chapter walks through six of them, each anchored to the question it answers better than the conventional alternative. Continue →