Skip to content
Time-Series
Econometrics
Ian Helfrich PhD ↗

First edition · October 2026

Time-Series Econometrics

Ian Helfrich, PhD

Fifteen lectures with derivations, worked examples, and executable laboratories in R, Julia, and Python.

Download the book, code, and data Use your browser’s print command to save these lectures as a PDF.

Lecture 1

The decision and its information set

What could the decision maker actually have known?

Begin with a forecast someone must use

A regional electricity planner must choose a reserve for next month. An underprediction can leave insufficient capacity; an overprediction can commit expensive capacity that remains idle. The object of interest is neither an attractive fitted curve nor a coefficient with a small standard error. It is a decision made before next month’s demand is observed.

Write a sentence that names the decision, the target, the unit, and the clock. For this case: “At the end of month tt, forecast the total megawatt-hours sold to residential customers in a specified state during month t+1t+1, using the records available by the forecast date.” A change from residential sales to total generation changes the economic object. A change from a state to a utility service area changes the population. A change from the end of the month to the middle of the month changes the information available. Those changes belong in the specification before a model is selected.

Let Yt+hY_{t+h} denote the target at horizon hh, and let It\mathcal I_t denote the information available at the decision time. Under squared-error loss, the ideal forecast is

Y^t+h∣t=E[Yt+h∣It].\widehat Y_{t+h|t}=\mathbb E[Y_{t+h}\mid\mathcal I_t].

This notation encodes a restriction. The forecast must be a function of It\mathcal I_t. It cannot depend on an observation released tomorrow, even if that observation describes yesterday. The target date and the availability date are different attributes of a record.

We will use an argument ledger throughout the course. Each entry records a decision date, a target definition, the information admitted, the proposed model, the result that would count against it, and the action justified by the result. Begin the ledger before seeing a model comparison. Its purpose is to make changes in reasoning visible. A forecaster can revise a model; a forecaster cannot retroactively claim to have made the revised decision earlier.

Why conditional expectation solves this loss

Take any forecast aa measurable with respect to It\mathcal I_t. Let m=E[Y∣It]m=\mathbb E[Y\mid\mathcal I_t], temporarily suppressing the target subscript. Decompose the conditional expected loss:

E[(Y−a)2∣It]=E[(Y−m+m−a)2∣It]=Var⁡(Y∣It)+(m−a)2.\begin{aligned} \mathbb E[(Y-a)^2\mid\mathcal I_t] &=\mathbb E[(Y-m+m-a)^2\mid\mathcal I_t]\\ &=\operatorname{Var}(Y\mid\mathcal I_t)+(m-a)^2. \end{aligned}

The cross term vanishes because E[Y−m∣It]=0\mathbb E[Y-m\mid\mathcal I_t]=0. The first term does not depend on aa. The second is minimized at a=ma=m. This proves an optimality statement for a specified information set and a specified loss. It does not say a linear regression consistently estimates that conditional expectation, or that squared loss matches the planner’s actual costs.

The units also agree. If YY is measured in MWh, mm and aa are in MWh; variance and squared loss are in MWh squared. An error reported in dollars cannot be compared directly with an error in MWh. A loss function that translates quantities into costs must specify that conversion.

Forecast errors obey an orthogonality condition. For any integrable ZZ known at the decision date,

E[(Y−m)Z]=0,\mathbb E[(Y-m)Z]=0,

when the needed moments exist. Systematic errors correlated with an available predictor suggest information was left unused. Errors correlated with a future predictor need not reveal a feasible improvement. This difference will recur when we examine residual diagnostics and structural interpretations.

A series has more than one date

Represent a record as (p,a,v,g,x)(p,a,v,g,x): period described, availability date, vintage, geographic unit, and value. The latest published series usually selects the latest vintage for each period. A historical decision requires the vintage available at that earlier date. If GDP for quarter pp was first published in p+1p+1 and subsequently revised, using the latest value at the old forecast origin changes both availability and measurement.

The course’s public teaching data are fixed extracts. Unless a dataset explicitly contains historical releases, it supports a pseudo-out-of-sample experiment on the downloaded vintage. Such an experiment respects the ordering of periods while retaining the values currently recorded for those periods. It does not reconstruct the complete information set of a historical forecaster. That qualification is a property of the data, not a defect that a better forecasting algorithm can remove.

The lecture’s release-clock example makes this distinction concrete. Periods are numbered from zero, and a record for period pp becomes available in period p+2p+2. At decision date 8, period 6 is the latest available observation. A training sample through period 8 would include two unreleased records. The code filters on release <= origin before selecting the latest period. In an applied project, dates replace the integers, but the rule is identical.

A valid forecasting table should retain origin, target_period, available_through, model_version, forecast, and, once observed, actual. Joining predictions to actuals by row position is unsafe after missing months or revisions. Join by explicit target identifiers and check that every forecast precedes the target’s availability.

Geographic aggregation changes the variable

Suppose a state has two areas with temperatures 40∘F40^\circ F and 80∘F80^\circ F, and equal weights. Its mean temperature is 60∘F60^\circ F. Define heating degree days relative to 65∘F65^\circ F as H(T)=max⁡(65−T,0)H(T)=\max(65-T,0). Transforming the state mean produces H(60)=5H(60)=5. Transforming each area first and averaging produces (H(40)+H(80))/2=12.5(H(40)+H(80))/2=12.5.

H ⁣(∑iwiTi)≠∑iwiH(Ti).H\!\left(\sum_i w_iT_i\right)\ne\sum_iw_iH(T_i).

Here the inequality follows from the kink in HH. More generally, Jensen’s inequality gives H(E[T])≤E[H(T)]H(\mathbb E[T])\leq\mathbb E[H(T)] because HH is convex. Aggregating first erases some exposure to cold locations. The course code returns 5 and 12.5 from the same temperature observations. This is an exact arithmetic example, independent of sampling error.

Weights must also represent an economic object. Population weights approximate exposure of people; electricity-customer weights approximate exposure of customers; geographic area weights approximate exposure of land. None is automatically the right measure of electricity demand. If weights change over time, a change in the index can reflect changing composition as well as changing temperatures. Retaining fixed weights answers a different question from updating them.

A useful measurement specification names the source locations, inclusion rules, units, weights, missing-value treatment, and transformation order. Boundary changes require a crosswalk or a declared break. A station average should not silently become a population-weighted state measure. This is where geographic econometrics enters the course: the geography determines the observed variable before a temporal model is fitted.

Establish a benchmark before adding complexity

For a persistent level, the naive forecast is Y^t+1∣t=Yt\widehat Y_{t+1|t}=Y_t. For a monthly seasonal series, the seasonal naive forecast is Y^t+h∣t=Yt+h−12k\widehat Y_{t+h|t}=Y_{t+h-12k}, where kk is the smallest positive integer making the referenced month available. For a series with a stable mean, a training-sample mean can be another benchmark. These are different economic assumptions expressed as forecast rules.

The naive forecast assumes that the last level is a useful anchor. The seasonal naive forecast assumes the same calendar month of the prior year is a useful anchor. A historical mean assumes the relevant mean has remained stable. Benchmarks can fail; the point of specifying them is to know what a complicated model improves upon.

Do not choose a benchmark after seeing which one makes your preferred model look best. Record the benchmark and loss in the ledger, then hold them fixed through the first comparison. If the economic target later changes, open a new comparison with a stated reason.

The synthetic series in this lecture is Yt=100+XtY_t=100+X_t, where Xt=0.8Xt−1+εtX_t=0.8X_{t-1}+\varepsilon_t. Its units are teaching units, not observed electricity sales. The executable example evaluates the naive forecast on the final 60 targets. Run the same shared fixture in each language; the reported root mean squared error should agree to numerical tolerance. We will add an estimated autoregression and a matched forecast-origin comparison in Lecture 4.

Execute, break, and repair

Download the complete laboratory bundle, extract it, and open a terminal in its code directory. In Python, run uv sync --locked once and then uv run python ch01.py; in R, run Rscript ch01.R; in Julia, run julia --startup-file=no ch01.jl. The code page lists the tested versions. Each entry point calls the implementation in the corresponding course file and cannot run outside that directory. All implementations read the same innovations.csv. The file contains simulated shocks generated by a documented algorithm; it is not a sample of observed economic outcomes.

Before running, predict the latest available period and both heating-degree-day measures. Record your predictions. After running, inspect the transformation order in the source. Then replace the availability filter release <= origin with the period filter period <= origin. Periods 7 and 8 enter the training rows, and the code’s audit, which looks up each included record’s own release date and asserts that it is at most the origin, fails. Restore the availability filter and confirm that the audit passes with seven included records. An assertion that only restates the filter it is meant to check could never fail; this one compares each selected row with its own release date, whichever filter selected it.

Next alter the geographic weights from (0.5,0.5)(0.5,0.5) to (0.8,0.2)(0.8,0.2). Compute both orders of transformation by hand. The weighted temperature becomes 48∘F48^\circ F, its heating degree days become 17, and the weighted local heating measure becomes 20. The direction of Jensen’s inequality remains unchanged. The size of the discrepancy changes because the economic weights changed.

Practice with a worked answer

A monthly observation describes March, is released May 10, and is revised July 15. A forecast is issued May 1. Can the forecaster use the first release? Can a retrospective analyst use the July vintage to claim a real-time May 1 forecast?

The first answer is no: May 10 follows May 1. The second answer is also no: the July value was unavailable at the original decision date. The analyst can run a retrospective experiment using the July vintage, provided that experiment is labeled accordingly. To reconstruct a real-time forecast, the analyst needs the records actually available on May 1, possibly ending before March.

Now suppose monthly electricity sales are a flow and end-of-month installed capacity is a stock. How should a quarterly series be formed? Sum the three monthly sales flows. Use an explicitly defined quarter-end capacity stock, or an average stock if the question concerns average capacity during the quarter. Summing three installed-capacity stocks would count the same equipment repeatedly and change the quantity’s meaning.

Your ledger entry should now state a target, a release rule, a geographic definition, a benchmark, and one result that would force revision. Keep this entry for Project 1. The next lecture will replace the benchmark’s implicit dynamics with a model whose behavior we can derive.

Sources and further reading

The EIA-861M data documentation defines electricity sales, sectors, and state adjustments. The NOAA Climate at a Glance documentation describes geographic climate series. The forecasting distinction between training residuals and test errors is developed in Forecasting: Principles and Practice, Section 5.8.
Lecture 2

Persistence, recursion, and aggregation

How does a shock persist, and what changes when observations are aggregated?

A model for a persistent economic level

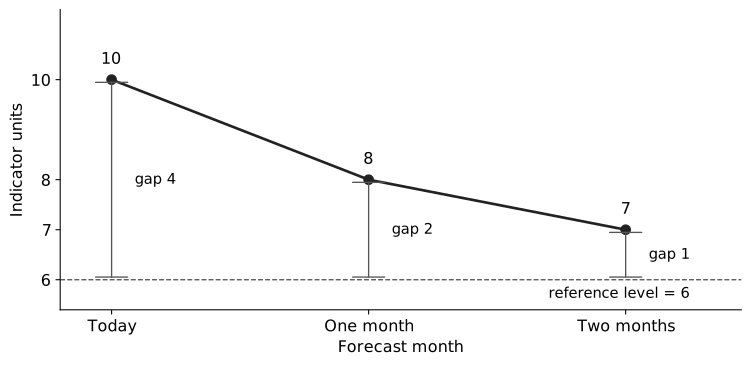
Suppose a monthly economic indicator is 10 today. We need a forecast for the next two months. Our model adds 3 each month and carries forward half the previous value. With no new shock, next month’s value is 3+0.5×10=83+0.5\times10=8. One month later it is 3+0.5×8=73+0.5\times8=7.

Why does the forecast move down? A value of 6 reproduces itself: 3+0.5×6=63+0.5\times6=6. Today the indicator is 4 units above that level. One step leaves half the gap; two steps leave a quarter. We can therefore calculate the same two-month forecast as 6+0.52(10−6)=76+0.5^2(10-6)=7. These are invented numbers for a hand calculation; they are not estimates for the Texas electricity case.

The forecast starts at 10, moves to 8, then to 7. The reference level is 6, and the remaining gaps are 4, 2, and 1 indicator units. This is an original analytic teaching example.

Now write the rule as

Yt=c+ϕYt−1+εt,E[εt∣It−1]=0,E[εt2]=σ2.Y_t=c+\phi Y_{t-1}+\varepsilon_t, \qquad \mathbb E[\varepsilon_t\mid\mathcal I_{t-1}]=0, \qquad\mathbb E[\varepsilon_t^2]=\sigma^2.

The model is an autoregression of order one, abbreviated AR(1). Here c=3c=3 and ϕ=0.5\phi=0.5. The coefficient ϕ\phi describes how much of a deviation survives one period. The intercept cc is the increment in the recursion; the reference level is c/(1−ϕ)c/(1-\phi) when ∣ϕ∣<1|\phi|<1. The innovation εt\varepsilon_t is what the previous information could not predict. Its zero conditional mean lets the calculations above serve as forecasts even though future shocks will usually be nonzero.

The conditional-mean restriction rules out predictable innovations. Serially uncorrelated errors alone do not imply independence, Gaussianity, or this restriction. The second moment displayed above is unconditional: it averages across histories. It does not require the risk faced at each history to be the same. We will state the stronger condition when we calculate a conditional forecast variance. Treat cc and ϕ\phi as known until the section on estimation uncertainty.

Here It\mathcal I_t contains the observations and innovations through tt; these information sets grow as records arrive. The known recursion lets us recover an observed innovation as Yt−c−ϕYt−1Y_t-c-\phi Y_{t-1}. All innovations have finite second moments. These conditions make the conditioning steps below meaningful.

Lecture 1’s conditional-expectation proof explains why averaging the unknown future given today’s information minimizes squared forecast loss. Here we apply that result to a specific recursion.

If YY is in MWh, cc and ε\varepsilon are in MWh and ϕ\phi is dimensionless. The interval represented by one time step matters. A monthly persistence coefficient cannot be substituted directly into a quarterly recursion.

Solve the difference equation

Substitute the recursion repeatedly:

Yt=ϕtY0+c∑j=0t−1ϕj+∑j=0t−1ϕjεt−j.Y_t=\phi^tY_0+c\sum_{j=0}^{t-1}\phi^j+ \sum_{j=0}^{t-1}\phi^j\varepsilon_{t-j}.

To see the pattern, the first substitution gives Y2=ϕ2Y0+c(1+ϕ)+ϕε1+ε2Y_2=\phi^2Y_0+c(1+\phi)+\phi\varepsilon_1+\varepsilon_2. One more substitution multiplies every existing term by ϕ\phi, then adds c+ε3c+\varepsilon_3. Thus a shock from jj periods ago receives exactly jj multiplications by ϕ\phi.

The finite geometric sum also has a short proof. Write St=1+ϕ+⋯+ϕt−1S_t=1+\phi+\cdots+\phi^{t-1}. Subtract ϕSt=ϕ+⋯+ϕt\phi S_t=\phi+\cdots+\phi^t from it; all interior terms cancel, leaving (1−ϕ)St=1−ϕt(1-\phi)S_t=1-\phi^t. Hence St=(1−ϕt)/(1−ϕ)S_t=(1-\phi^t)/(1-\phi) when ϕ≠1\phi\ne1. At ϕ=1\phi=1, each term equals one and St=tS_t=t.

For ϕ≠1\phi\ne1, the deterministic component is ϕtY0+c(1−ϕt)/(1−ϕ)\phi^tY_0+c(1-\phi^t)/(1-\phi). If ∣ϕ∣<1|\phi|<1, the initial condition’s influence decays. Under the finite-moment conditions specified next, a stationary solution can be written

Yt=μ+∑j=0∞ϕjεt−j,μ=c1−ϕ.Y_t=\mu+\sum_{j=0}^{\infty}\phi^j\varepsilon_{t-j}, \qquad \mu=\frac{c}{1-\phi}.

For this representation, let the innovation sequence extend through all integer dates, with zero means, common variance σ2\sigma^2, and zero covariances across distinct dates. The mean-square size of the omitted tail after mm terms is σ2∑j=m∞ϕ2j\sigma^2\sum_{j=m}^{\infty}\phi^{2j}, which tends to zero when ∣ϕ∣<1|\phi|<1. That establishes mean-square convergence. The resulting mean is constant and its covariance depends only on the lag, so the solution is covariance-stationary. Strict stationarity, which concerns the entire joint distribution, requires a strictly stationary innovation sequence as well.

A simulation initialized at an arbitrary fixed Y0Y_0 has a transient; it is not exactly stationary from its first row. Discarding a burn-in approximates the covariance-stationary regime, with approximation quality depending on persistence.

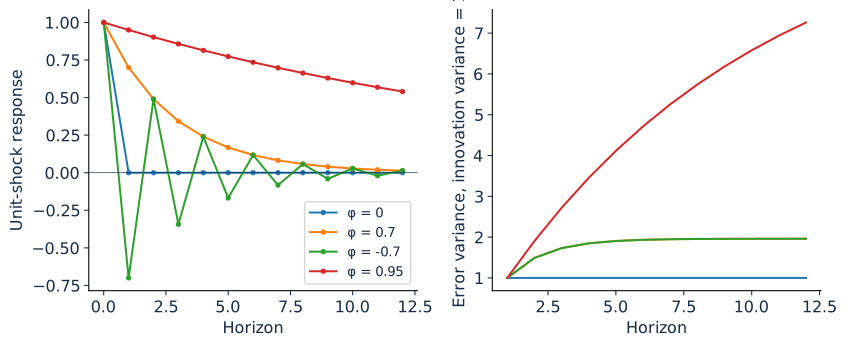
For ϕ=0\phi=0, each observation is c+εtc+\varepsilon_t. For 0<ϕ<10<\phi<1, deviations decay without alternating signs. For −1<ϕ<0-1<\phi<0, their signs alternate while their magnitudes decay. At ϕ=1\phi=1, the formula for μ\mu is undefined and the model becomes a random walk with drift. For ∣ϕ∣>1|\phi|>1, the forward recursion is explosive. Those boundary cases should change an implementation’s interpretation, not merely trigger a divide-by-zero warning.

Derive the population moments

Taking expectations in a stationary solution yields μ=c+ϕμ\mu=c+\phi\mu, hence μ=c/(1−ϕ)\mu=c/(1-\phi). Subtract the mean and define Xt=Yt−μX_t=Y_t-\mu. Then

Xt=ϕXt−1+εt.X_t=\phi X_{t-1}+\varepsilon_t.

The previous state is known in It−1\mathcal I_{t-1}, so E[Xt−1εt]=E[Xt−1E[εt∣It−1]]=0\mathbb E[X_{t-1}\varepsilon_t]=\mathbb E[X_{t-1}\mathbb E[\varepsilon_t\mid\mathcal I_{t-1}]]=0. Squaring the centered recursion and taking expectations therefore gives

γ(0)=ϕ2γ(0)+σ2.\gamma(0)=\phi^2\gamma(0)+\sigma^2.

Stationarity supplies the same variance for XtX_t and Xt−1X_{t-1}. Subtract ϕ2γ(0)\phi^2\gamma(0) from both sides and divide by 1−ϕ21-\phi^2, which is positive for ∣ϕ∣<1|\phi|<1: Var⁡(Yt)=γ(0)=σ2/(1−ϕ2)\operatorname{Var}(Y_t)=\gamma(0)=\sigma^2/(1-\phi^2).

Define γ(k)=E[XtXt−k]\gamma(k)=\mathbb E[X_tX_{t-k}]. Multiply the centered recursion by Xt−kX_{t-k} and take expectations. For k≥1k\ge1, Xt−kX_{t-k} is known before the innovation, so the same conditioning argument makes its product with εt\varepsilon_t contribute zero. The remaining product is ϕE[Xt−1Xt−k]=ϕγ(k−1)\phi\mathbb E[X_{t-1}X_{t-k}]=\phi\gamma(k-1) by stationarity. Iterating gives

γ(k)=ϕkγ(0),ρ(k)=ϕk.\gamma(k)=\phi^k\gamma(0),\qquad\rho(k)=\phi^k.

Covariance has squared outcome units. Correlation and persistence are dimensionless. As ∣ϕ∣|\phi| approaches one with σ2\sigma^2 held fixed, stationary variance grows without bound. A small innovation variance therefore does not guarantee a stable level. Negative persistence gives alternating correlations, while variance depends on ϕ2\phi^2.

The laboratory uses c=0.6c=0.6, ϕ=0.7\phi=0.7, and σ2=1\sigma^2=1. Its population mean is 2 and population variance is approximately 1.9608. The simulated sample will differ. That discrepancy is evidence of finite-sample variation; it should not be repaired by changing the population formulas to match the realized sample.

Comparing a time average with a population moment needs one more condition, because stationarity alone does not make time averages converge. Draw ZZ once and let Yt=Z+εtY_t=Z+\varepsilon_t with independent innovations. The process is strictly stationary, yet its sample mean converges to the realized ZZ rather than to E[Yt]\mathbb E[Y_t]: one long history reveals nothing about the other values ZZ could have taken. The missing property is ergodicity, under which time averages of functions of the process converge to their expectations. For a strictly stationary process, a sufficient condition is mixing, under which events far apart in time become asymptotically independent. For the sample mean of a stable AR(1), less is needed. Under the linear-process assumptions above, the autocovariances are absolutely summable, so Var⁡(Y‾)→0\operatorname{Var}(\overline Y)\to0 and Y‾\overline Y converges in mean square to μ\mu. Sample variances, autocovariances, and the least-squares estimators of later lectures need more, such as independent innovations with finite variance, martingale-difference innovations with suitable higher moments, or a mixing condition that supports a law of large numbers and a central limit theorem for dependent data. Later laboratories assume conditions of this kind whenever they treat a time average as an estimate.

Forecast more than one period ahead

At date tt, iterate the centered recursion forward:

Yt+h=μ+ϕh(Yt−μ)+∑j=0h−1ϕjεt+h−j.Y_{t+h}=\mu+\phi^h(Y_t-\mu) +\sum_{j=0}^{h-1}\phi^j\varepsilon_{t+h-j}.

Under the innovation conditional-mean restriction, the forecast is

Y^t+h∣t=μ+ϕh(Yt−μ)⏟retained deviation.\widehat Y_{t+h|t}=\mu+\underbrace{\phi^h(Y_t-\mu)}_{\text{retained deviation}}.

Each future innovation has zero conditional mean given date-tt information: condition first on the information immediately before that innovation, use its zero conditional mean, then condition on It\mathcal I_t. That removes it from the forecast, but its squared contribution remains in the error. The same conditioning argument makes the cross-products of innovations at different dates vanish.

Take two future dates t<i<kt<i<k. The earlier innovation is already known in Ik−1\mathcal I_{k-1}, and It\mathcal I_t is contained in that information set. Conditional expectation therefore gives

E[εiεk∣It]=E[εiE[εk∣Ik−1]∣It]=0.\mathbb E[\varepsilon_i\varepsilon_k\mid\mathcal I_t] =\mathbb E[\varepsilon_i\mathbb E[\varepsilon_k\mid\mathcal I_{k-1}]\mid\mathcal I_t]=0.

The inner expectation is zero by the model’s innovation restriction. Averaging the resulting zero over the histories also gives an unconditional zero cross-product. Expand the squared forecast error: the cross-terms disappear, leaving each innovation’s second moment multiplied by its squared coefficient. With the common unconditional second moment σ2\sigma^2, this yields the unconditional mean-squared forecast error

Vh=σ2∑j=0h−1ϕ2j=σ21−ϕ2h1−ϕ2.V_h=\sigma^2\sum_{j=0}^{h-1}\phi^{2j} =\sigma^2\frac{1-\phi^{2h}}{1-\phi^2}.

For this same number to be the conditional forecast variance at every history, assume conditional homoskedasticity: E[εs2∣Is−1]=σ2\mathbb E[\varepsilon_s^2\mid\mathcal I_{s-1}]=\sigma^2 for the future dates involved. The word means that the next innovation’s variance is constant given the available history. Without that condition, the conditional variance instead sums ϕ2jE[εt+h−j2∣It]\phi^{2j}\mathbb E[\varepsilon_{t+h-j}^2\mid\mathcal I_t] over j=0,…,h−1j=0,\ldots,h-1. The forecast mean can remain correct while its conditional risk changes.

For h=1h=1, Vh=σ2V_h=\sigma^2. For a stable process, it increases toward the unconditional level variance. At ϕ=1\phi=1, use the finite sum directly: Vh=hσ2V_h=h\sigma^2. Numerical cancellation near one can make the quotient less accurate than the sum.

With the opening example’s ϕ=0.5\phi=0.5 and innovation standard deviation 2, the two-month error is 0.5εt+1+εt+20.5\varepsilon_{t+1}+\varepsilon_{t+2}. Under conditional homoskedasticity its variance is 0.52×4+4=50.5^2\times4+4=5 squared indicator units. Changing ϕ\phi to −0.5-0.5 reverses the first innovation’s contribution but leaves its squared weight at 0.250.25. The response can alternate while the variance remains positive. Change persistence and compare both quantities.

A changed example: what if risk depends on the history?

An observed risk state chooses an innovation scale of 1 or 3, each with probability one half, and retains that scale over the two forecast months. Each month’s innovation is the scale times an independent sign, equally likely to be −1-1 or 11. What are the two conditional error variances when ϕ=0.5\phi=0.5? What is their unconditional average?

In the low-risk state, variance is 12(1+0.52)=1.251^2(1+0.5^2)=1.25. In the high-risk state it is 32(1+0.52)=11.253^2(1+0.5^2)=11.25. Their average is 6.256.25, which also equals E[εs2](1+0.52)=5×1.25\mathbb E[\varepsilon_s^2](1+0.5^2)=5\times1.25. Zero conditional means and constant unconditional second moments hold, but conditional homoskedasticity fails. Reporting 6.25 as the risk at either observed history would be wrong. The independent signs permit an exact eight-outcome enumeration across the two risk states; no simulation is needed for this example.

A shock’s response after hh periods is ϕh\phi^h times its initial size. For 0<ϕ<10<\phi<1, solving ϕh=0.5\phi^h=0.5 gives the half-life log⁡(0.5)/log⁡(ϕ)\log(0.5)/\log(\phi). This is a real-valued number of model periods; actual discrete responses reach or fall below half their original magnitude at the ceiling of that number. For −1<ϕ<0-1<\phi<0, use ∣ϕ∣|\phi| to describe magnitude decay and retain the alternating sign separately.

The known-parameter variance excludes parameter uncertainty. When cc and ϕ\phi are estimated, a plug-in forecast is a random function of an estimated model. Its interval requires additional care, especially in a short sample or near a unit root. Lecture 4’s forecast-uncertainty discussion distinguishes process uncertainty, estimation uncertainty, and uncertainty about model selection.

Time aggregation changes the dependence

Suppose a monthly centered AR(1) is observed only through quarterly averages

Qs=X3s−2+X3s−1+X3s3.Q_s=\frac{X_{3s-2}+X_{3s-1}+X_{3s}}3.

Using γ(k)=γ(0)ϕ∣k∣\gamma(k)=\gamma(0)\phi^{|k|},

Var⁡(Qs)=γ(0)9(3+4ϕ+2ϕ2).\operatorname{Var}(Q_s)=\frac{\gamma(0)}9(3+4\phi+2\phi^2).

There are three diagonal covariance terms, four ordered pairs at distance one, and two at distance two. Between adjacent quarters, the nine pairwise distances are 1, 2, 2, 3, 3, 3, 4, 4, and 5. Thus

Cov⁡(Qs,Qs−1)=γ(0)9(ϕ+2ϕ2+3ϕ3+2ϕ4+ϕ5).\operatorname{Cov}(Q_s,Q_{s-1}) =\frac{\gamma(0)}9(\phi+2\phi^2+3\phi^3+2\phi^4+\phi^5).

Their ratio is generally different from ϕ3\phi^3. Sampling the last month of each quarter produces a different dependence structure from averaging all three months. The aggregate process can require moving-average terms even when the original process is a simple autoregression. This is a substantive measurement issue: the model belongs to the frequency and aggregation rule actually used.

For a quarterly flow total, replace the average by a sum. Variance and covariance both multiply by nine, leaving the correlation unchanged. The level’s units change from a monthly quantity to a quarterly total, so its intercept and forecast scale change. A rate or index may instead require an economically defined weighted average.

A unit shock can alternate while error variance remains positive. These are original analytic curves with innovation variance one; the variance is conditional under homoskedasticity and unconditional under constant unconditional second moments.

Execute the recursion and audit the result

Run ch02 in your preferred language. The source implements the recursion directly and computes the four-step forecast twice: by applying the recursion four times to the last observation, and by the closed formula μ+ϕ4(Yt−μ)\mu+\phi^4(Y_t-\mu). It asserts that the two agree to 10−1210^{-12} and reports both. The same program compares the finite variance sum with its quotient and asserts numerical agreement, and it averages consecutive groups of three monthly observations to estimate an AR(1) coefficient on that aggregate.

First predict whether that aggregate coefficient should equal 0.730.7^3. Use the covariance expressions above to explain your prediction. Compare the realized estimate with the implied aggregate lag-one correlation; finite samples and the fitted intercept will introduce differences. A single sample is a demonstration, not a consistency proof.

Then repeat the recursion at ϕ=0\phi=0, 0.950.95, −0.7-0.7, and 11. At one, retain the finite forecast-error sum and stop reporting a stationary population mean. At 0.950.95, increase the burn-in and explain why the shorter burn-in retained more initial-condition influence. The code’s baseline burn-in is an explicit design choice, not a universal guarantee.

Worked problem and project connection

Return to the opening example with c=3c=3, ϕ=0.5\phi=0.5, innovation standard deviation 2, and current value 10. Its stationary mean is 6 and its two-period forecast is 7. Under conditional homoskedasticity, its known-parameter conditional error variance is 5 and its standard deviation is 5\sqrt5. If the future innovations are independent Gaussian draws, the conditional Gaussian 95% interval is 7±1.9657\pm1.96\sqrt5. Using 1.96 rounds the normal quantile; variance alone does not justify a Gaussian interval.

If the current value changes from 10 to 14, the two-period forecast increases by 0.52(4)=10.5^2(4)=1. The error variance is unchanged because this homoskedastic model makes variance independent of the current level. If observed forecast risk increases with the level, this model’s variance assumption deserves an audit.

In Project 1: A forecast someone can use, use an AR model as a transparent competitor to the benchmark. Report the series frequency, its aggregation rule, fitted persistence, and the estimation window. Describe which disturbance remains unexplained. The next lecture will expand the dependence structure while preserving the distinction between observable histories and unobserved innovations.

Further reading

For the transition from independent Gaussian shocks to the weaker zero-conditional-mean condition, see QuantEcon’s discussion of martingale difference shocks. Its prediction section develops the state-space generalization. The ARIMA chapter in Forecasting: Principles and Practice supplies forecasting context. The numerical examples and graphics in this lecture are original teaching calculations.

Lecture 3

ARMA models and recoverable innovations

Can the observed history reveal the shocks that generated it?

Separate propagation from innovation memory

An autoregression propagates past outcomes. A moving-average model carries past innovations into the current observation. For a centered series, an ARMA(1,1) combines both:

Xt=ϕXt−1+εt+θεt−1.X_t=\phi X_{t-1}+\varepsilon_t+\theta\varepsilon_{t-1}.

Our convention places a plus sign before θ\theta. Software packages and textbooks sometimes use different signs. Record the convention before comparing estimates. A coefficient disagreement caused by opposite conventions is a notation mismatch, not an empirical contradiction.

Define the lag operator LXt=Xt−1LX_t=X_{t-1}. The model is (1−ϕL)Xt=(1+θL)εt(1-\phi L)X_t=(1+\theta L)\varepsilon_t. A general ARMA(p,q)(p,q) has

Φ(L)Xt=Θ(L)εt,Φ(z)=1−∑i=1pϕizi,Θ(z)=1+∑j=1qθjzj.\Phi(L)X_t=\Theta(L)\varepsilon_t, \quad \Phi(z)=1-\sum_{i=1}^p\phi_i z^i, \quad\Theta(z)=1+\sum_{j=1}^q\theta_jz^j.

For a causal stationary representation, the roots of Φ(z)=0\Phi(z)=0 must lie outside the unit circle. For an invertible innovation representation, the roots of Θ(z)=0\Theta(z)=0 must lie outside it. These conditions concern different polynomials and different questions. For ARMA(1,1), they become ∣ϕ∣<1|\phi|<1 and ∣θ∣<1|\theta|<1, respectively.

Build the moving-average representation

When ∣ϕ∣<1|\phi|<1,

Xt=1+θL1−ϕLεt=∑j=0∞ψjεt−j,X_t=\frac{1+\theta L}{1-\phi L}\varepsilon_t =\sum_{j=0}^{\infty}\psi_j\varepsilon_{t-j},

where ψ0=1\psi_0=1 and ψj=(ϕ+θ)ϕj−1\psi_j=(\phi+\theta)\phi^{j-1} for j≥1j\ge1. Obtain the coefficients by multiplying (1+θL)(1+\theta L) by ∑j≥0ϕjLj\sum_{j\ge0}\phi^jL^j. This representation shows the immediate innovation effect and the later propagation effects.

With serially uncorrelated innovations of variance σ2\sigma^2,

γ(0)=σ2∑j≥0ψj2=σ21+θ2+2ϕθ1−ϕ2.\gamma(0)=\sigma^2\sum_{j\ge0}\psi_j^2 =\sigma^2\frac{1+\theta^2+2\phi\theta}{1-\phi^2}.

The numerator and denominator are dimensionless, leaving squared outcome units. At θ=0\theta=0, this reduces to the AR(1) variance. At ϕ=0\phi=0, it becomes σ2(1+θ2)\sigma^2(1+\theta^2), the MA(1) variance. At θ=−ϕ\theta=-\phi, the lag polynomials cancel and Xt=εtX_t=\varepsilon_t. Such common factors make an unnecessarily large model observationally redundant.

The lag-one covariance is

γ(1)=ϕγ(0)+θσ2.\gamma(1)=\phi\gamma(0)+\theta\sigma^2.

Multiply the original recursion by Xt−1X_{t-1} and take expectations. The current innovation is uncorrelated with the past, while Cov⁡(εt−1,Xt−1)=σ2\operatorname{Cov}(\varepsilon_{t-1},X_{t-1})=\sigma^2. For k≥2k\ge2, γ(k)=ϕγ(k−1)\gamma(k)=\phi\gamma(k-1). The first lag therefore contains both autoregressive propagation and moving-average memory; later lags decay geometrically.

Why invertibility matters

For an MA(1), Xt=εt+θεt−1X_t=\varepsilon_t+\theta\varepsilon_{t-1}. If ∣θ∣<1|\theta|<1,

εt=(1+θL)−1Xt=∑j=0∞(−θ)jXt−j.\varepsilon_t=(1+\theta L)^{-1}X_t =\sum_{j=0}^{\infty}(-\theta)^jX_{t-j}.

The coefficients decay, so distant observations have diminishing influence on the recovered innovation. If ∣θ∣>1|\theta|>1, this backward recursion amplifies initialization error. A stable series can therefore have a noninvertible representation: stationarity does not guarantee stable recovery of shocks from observed history.

The MA(1) autocorrelation is ρ(1)=θ/(1+θ2)\rho(1)=\theta/(1+\theta^2) and ρ(k)=0\rho(k)=0 for k>1k>1. Replacing θ\theta by 1/θ1/\theta preserves ρ(1)\rho(1). It also preserves the covariance function if the innovation variance is rescaled to θ2σ2\theta^2\sigma^2. Gaussian processes with these matched covariance functions have the same distribution. An invertibility convention selects the representation with recoverable innovations; the ACF alone cannot distinguish reciprocal MA roots.

This does not mean all non-Gaussian models with the same covariance are identical in every respect. Covariance characterizes second-order behavior; additional distributional information can matter. Our elementary identification statement should remain within its assumptions.

Read an ACF and PACF without treating them as verdicts

The autocorrelation function measures the association between XtX_t and Xt−kX_{t-k}. The partial autocorrelation at lag kk removes linear dependence on the intervening k−1k-1 lags. Equivalently, it is the final coefficient in the population linear projection of XtX_t onto its first kk lags under the usual nonsingularity conditions.

For a pure AR(p)(p), the population PACF cuts off after pp and the ACF generally tails off. For a pure MA(q)(q), the population ACF cuts off after qq and the PACF generally tails off. For a mixed ARMA, both can tail off. Seasonal dynamics introduce patterns at seasonal lags. Differencing, finite samples, parameter cancellation, and near-unit roots complicate these pictures.

An estimated ACF is noisy. A familiar ±1.96/n\pm1.96/\sqrt n band is a rough white-noise reference, not a simultaneous confidence band for every lag of every fitted model. Inspecting many lags creates many opportunities for an apparent excursion. Use the plots to propose a short candidate list, then check residuals and evaluate the candidates on later targets.

Information criteria rank such a list. For a Gaussian model with kk estimated parameters fitted to nn observations, and up to terms common to every candidate,

AIC⁡=nlog⁡σ^2+2k,BIC⁡=nlog⁡σ^2+klog⁡n,\operatorname{AIC}=n\log\widehat\sigma^2+2k,\qquad \operatorname{BIC}=n\log\widehat\sigma^2+k\log n,

where σ^2\widehat\sigma^2 is the estimated innovation variance (Akaike 1974; Schwarz 1978). The preferred candidate minimizes the criterion. BIC’s penalty exceeds AIC’s once n≥8n\ge8, so BIC chooses smaller models. When the true orders are among the candidates, BIC selects them with probability approaching one, while AIC retains a positive probability of overfitting; AIC is designed instead to approximate expected predictive loss. Compute every criterion on a common estimation sample, because a model with more lags loses initial observations, and criteria computed on different samples are not comparable. Select the order inside the training window and treat that selection rule as part of the procedure that later targets evaluate.

The laboratory’s ARMA series has ϕ=0.6\phi=0.6 and θ=0.4\theta=0.4. Its sample lag-one correlation is substantially larger than the isolated MA(1) correlation 0.4/(1+0.42)0.4/(1+0.4^2). Comparing those two values does not reveal an error: one belongs to a mixed model and the other to a pure MA benchmark. Calculate the mixed-model population correlation using the formulas above before interpreting the sample.

Estimate a conditional model transparently

Given a candidate (ϕ,θ)(\phi,\theta) and an initialization ε^0=0\widehat\varepsilon_0=0, recover residuals recursively:

ε^t=Xt−ϕXt−1−θε^t−1.\widehat\varepsilon_t =X_t-\phi X_{t-1}-\theta\widehat\varepsilon_{t-1}.

Conditional sum of squares minimizes ∑tε^t2\sum_t\widehat\varepsilon_t^2. The source uses a small declared grid and excludes the first 30 residuals from the comparison. A grid estimate is transparent but coarse. It supplies neither exact maximum likelihood nor standard errors. Its pedagogical purpose is to expose the objective, initialization, parameter restrictions, and residual recursion before using a package optimizer.

When fitting real data, an exact Gaussian likelihood accounts for the initial state distribution; conditional likelihood conditions on initial information. Near boundaries, small-sample estimates can depend appreciably on that treatment. An optimizer’s successful exit does not prove the global optimum or the economic validity of the model. Retain its convergence information and inspect admissibility.

Estimate a mean explicitly, or center using training data only. Centering with the full sample before forecasting leaks future information into the historical regressors. The lecture’s synthetic ARMA is constructed with zero mean, so its grid search has no estimated mean term. That simplifying assumption must not silently migrate to an application with a changing level.

Execute, break, and repair

Run ch03 in all three languages. The declared grid includes the generating coefficients, and the shared realization selects them under the conditional criterion. The code records the conditional mean squared residual at all sixteen grid points. The minimum, 0.939 at (ϕ,θ)=(0.6,0.4)(\phi,\theta)=(0.6,0.4), is close to its neighbors 0.991 at (0.8,0.4)(0.8,0.4) and 1.010 at (0.4,0.4)(0.4,0.4), while (0.6,−0.4)(0.6,-0.4) gives 1.693. Use the grid to judge how sharply the objective distinguishes nearby candidates. Recover the residuals, then calculate their ACF. A model that reproduces the outcome’s ACF can still leave predictable residual patterns.

Set θ=1.2\theta=1.2 in the data generator and try the innovation recursion with that coefficient. Perturb the initial residual by a small amount. The initialization difference evolves as (−θ)t(-\theta)^t and grows in magnitude. Repeat at θ=0.4\theta=0.4; the difference decays. Repair the representation by finding the reciprocal invertible coefficient and rescaling innovation variance. Explain which features of the observed series are retained.

Next set θ=−ϕ\theta=-\phi. The simulated series collapses to white noise apart from initialization handling. A two-parameter model that seems flexible here is redundant. Simplify the representation and record the reason in the ledger.

Worked problems

For an MA(1) with θ=0.5\theta=0.5 and σ2=4\sigma^2=4, variance is 4(1+0.25)=54(1+0.25)=5 and lag-one covariance is 0.5(4)=20.5(4)=2. Thus ρ(1)=0.4\rho(1)=0.4. The reciprocal representation has coefficient 2 and innovation variance 1; its variance is again 5 and its lag-one covariance again 2. The first representation is invertible; the second is not.

For an ARMA(1,1) with ϕ=0.5\phi=0.5, θ=0.2\theta=0.2, and σ2=1\sigma^2=1, variance is (1+0.04+0.2)/(1−0.25)=1.6533‾(1+0.04+0.2)/(1-0.25)=1.653\overline3. Lag-one covariance is 0.5(1.6533‾)+0.2=1.0266‾0.5(1.653\overline3)+0.2=1.026\overline6, giving lag-one correlation approximately 0.621. Lag-two covariance is half the lag-one covariance. These checks establish the correct sign convention before any software result is interpreted.

For Project 1, declare a small candidate family and justify it through the target’s dynamics. Preserve the benchmark, information rule, and forecast origins. A larger model earns its place through a defensible improvement on that comparison. Lecture 4 specifies the comparison itself.

Further reading

QuantEcon’s ARMA lecture develops covariance-stationary processes in time and frequency domains. Forecasting: Principles and Practice discusses practical ARIMA model selection.

Lecture 4

Forecasts that survive a chronological comparison

Has the model improved a decision on targets it had not seen?

Fitting and forecasting answer different questions

A regression’s fitted values use coefficients estimated from its training sample. Their residuals describe how that fitted model represents observations it has already seen. A forecast uses a model constructed before its target is observed. Its errors describe performance on subsequent targets. A small training residual sum of squares can coexist with poor forecasting.

Begin with a historical sequence and a forecast origin tt. The training window ends at that origin, or at the latest earlier observation available under the release rule. Fit the model using only that window, issue a forecast for t+ht+h, and retain the prediction. Move the origin forward and repeat. This is rolling-origin evaluation. An expanding window starts at a fixed initial date; a rolling window retains a fixed number of recent observations.

An honest comparison holds the target periods, information rule, and loss fixed across methods. If one model is evaluated only on easy months and another on every month, their average losses are not comparable. If a model cannot produce a forecast at an origin, record that failure and apply a declared fallback rule. Do not silently drop the difficult target.

The comparison should reflect the intended deployment. Refitting at every origin evaluates a repeatedly updated procedure. Fitting once and holding coefficients fixed evaluates a different procedure. Both are legitimate designs if their interpretation is explicit.

The algorithm is part of the statistical model

For an estimated AR(1), the procedure at each origin solves

min⁡c,ϕ∑s∈Wt(Ys−c−ϕYs−1)2,\min_{c,\phi}\sum_{s\in W_t}(Y_s-c-\phi Y_{s-1})^2,

then iterates the estimated recursion hh steps. WtW_t contains admissible target-regressor pairs from that origin’s training window. A lagged outcome requires both rows to be available; missing periods must not turn adjacent rows into a false one-period lag.

The executable implementation uses QR-based least squares. Solving the normal equations by explicitly inverting X′XX'X is unnecessary and can amplify numerical problems. Rank checks detect a design with redundant columns or insufficient observations. This is a computational condition; rank sufficiency does not establish exogeneity, stationarity, or stability. Whether the estimated cc and ϕ\phi approach their population values as the training window grows is a statistical question, and the answer rests on stability together with the ergodicity and innovation conditions stated in Lecture 2.

Preprocessing also belongs inside the origin loop. Estimate a mean, standard deviation, imputation rule, seasonal adjustment, or principal component from training data. Apply the retained transformation to the admissible prediction inputs. A full-sample transformation can carry information from the test period into every historical forecast even when the regression itself is refitted correctly.

Tuning requires another boundary. Use an earlier validation segment to choose lag order or window length, then evaluate the chosen procedure on later targets. Repeatedly choosing a model after observing the same test errors turns that test segment into a selection sample. Lecture 14 will freeze a complete procedure before a continuation release.

Match loss to the decision

For errors et=Yt−Y^te_t=Y_t-\widehat Y_t, common summaries are

MAE⁡=1n∑t∣et∣,RMSE⁡=1n∑tet2.\operatorname{MAE}=\frac1n\sum_t|e_t|, \qquad \operatorname{RMSE}=\sqrt{\frac1n\sum_te_t^2}.

Both are in outcome units. RMSE emphasizes large errors. MAE has the conditional median as its population-optimal point forecast; squared loss has the conditional mean. Percentage errors are problematic near zero and can compare series in economically misleading ways. For a scaled error, calculate its scaling denominator from the training sample and state the benchmark defining that scale.

If underprediction costs cuc_u per unit and overprediction costs coc_o, define

L(a,Y)=cu(Y−a)++co(a−Y)+.L(a,Y)=c_u(Y-a)_++c_o(a-Y)_+.

For a continuous conditional distribution FF, differentiating expected loss with respect to aa gives −cu[1−F(a)]+coF(a)-c_u[1-F(a)]+c_oF(a). The optimum satisfies

F(a)=cucu+co.F(a)=\frac{c_u}{c_u+c_o}.

With cu=3c_u=3 and co=1c_o=1, the preferred action is the conditional 75th percentile. An unbiased conditional-mean forecast can therefore be an inappropriate reserve decision. The distinction is between estimating an outcome distribution and choosing an action from that distribution.

Identify the uncertainty in an interval

For a known-parameter stable AR(1), the hh-step process variance is Vh=σ2∑j=0h−1ϕ2jV_h=\sigma^2\sum_{j=0}^{h-1}\phi^{2j}. Gaussian innovations give a conditional Gaussian forecast distribution, so an interval is Y^±z1−α/2Vh\widehat Y\pm z_{1-\alpha/2}\sqrt{V_h}.

There are several practical qualifications. Estimating parameters adds uncertainty; selecting a model adds another layer; a future covariate may need its own forecast; a geographic measure may be uncertain; and a structural break can invalidate the fitted process entirely. A normal interval computed from a residual variance addresses only the assumptions included in that calculation.

One possible approximation for a one-step regression forecast adds the coefficient-estimation term:

σ^2[1+xt+1′(X′X)−1xt+1].\widehat\sigma^2\left[1+x_{t+1}'(X'X)^{-1}x_{t+1}\right].

This formula assumes the usual homoskedastic regression conditions and treats the prediction regressors appropriately. It is not a universal ARMA multi-step interval. With dependence, a simulation or bootstrap should preserve the relevant temporal structure and repeat the actual fitting procedure. Resampling individual time rows indiscriminately destroys that structure.

Check intervals empirically. Record coverage, average width, and behavior in periods relevant to the decision. High coverage from enormous intervals can be operationally unhelpful. Narrow intervals with severe undercoverage misstate risk. For overlapping multi-step targets, successive errors are dependent, so a binomial standard error is generally inappropriate without addressing that dependence.

Compare paired errors

Let eA,te_{A,t} and eB,te_{B,t} be errors on identical targets. Analyze

dt=L(eA,t)−L(eB,t).d_t=L(e_{A,t})-L(e_{B,t}).

A negative mean favors A for that loss and those targets. Pairing preserves the fact that both forecasts face the same difficult months. A standard error for d‾\overline d must reflect serial dependence, including dependence from overlapping horizons and repeated estimation. A heteroskedasticity-and-autocorrelation-consistent estimate or a carefully designed block bootstrap can be suitable under its assumptions.

The ratio d‾/se⁡^(d‾)\overline d/\widehat{\operatorname{se}}(\overline d) is the test of equal predictive accuracy proposed by Diebold and Mariano (1995), who treated the two forecast sequences as given. For hh-step forecasts, dtd_t inherits the MA(h−1)(h-1) dependence of overlapping errors described in the diagnostics section below, so the HAC estimate should include at least h−1h-1 lags. When a forecast is misspecified, as the no-change forecast is for the stationary AR(1) in this lecture’s laboratory, its errors and dtd_t can be dependent beyond lag h−1h-1, and h−1h-1 lags is then only a lower bound. The Bartlett weights of Newey and West (1987) keep the estimate nonnegative.

Forecasts from estimated models add a complication. West (1996) showed that parameter estimation can contribute a term to the asymptotic variance of d‾\overline d. His results require that variance to be positive, and that requirement fails when one model nests the other, which is the case in this lecture: the no-change forecast is the AR(1) with c=0c=0 and ϕ=1\phi=1. Under the null of equal population accuracy, the two nested forecasts coincide in population, the loss differential degenerates, and the DM statistic does not have a standard normal limit. Clark and McCracken (2001) and McCracken (2007) derive nonstandard critical values for such comparisons. Giacomini and White (2006) pose a different null: whether two forecasting methods, each including its estimation window, have equal expected loss given the information available at the origin. With an estimation window of fixed length, their test uses normal or chi-squared critical values for nested and non-nested models alike. An expanding window lies outside that framework.

Do not turn every small numerical difference into a superiority claim. The sample may be short, the decision costs may be poorly specified, or the improvement may disappear when the release lag changes. Report the size of the improvement and what it would change operationally. An inconclusive comparison can justify retaining a transparent benchmark.

Diagnose the innovation sequence

A useful residual audit asks whether mean bias remains, whether lagged residuals predict future residuals, whether squared residuals cluster, and whether errors differ across calendar periods or geographic regimes. A Ljung–Box statistic has the form

Q=n(n+2)∑k=1mρ^(k)2n−k.Q=n(n+2)\sum_{k=1}^m\frac{\widehat\rho(k)^2}{n-k}.

Its approximate reference distribution depends on model fitting and degrees-of-freedom adjustments. The statistic aggregates selected residual correlations; failing to reject does not prove independence or complete model correctness. Residual diagnostics complement later-target evaluation. They cannot substitute for it.

Apply the statistic to errors that a correct model would leave unpredictable. One-step errors of a correctly specified AR(1) are its innovations. An hh-step error,

et+h∣t=∑j=0h−1ϕjεt+h−j,e_{t+h|t}=\sum_{j=0}^{h-1}\phi^j\varepsilon_{t+h-j},

shares innovations with the errors issued at the h−1h-1 preceding origins. It is an MA(h−1)(h-1) process, and its first h−1h-1 autocorrelations are nonzero even when the model is exactly right. For ϕ=0.8\phi=0.8 and h=4h=4 they are 0.709, 0.454, and 0.221. Substituting them into QQ with the laboratory’s 237 four-step errors gives about 182, far above 15.5, the 5% critical value of a χ2(8)\chi^2(8) reference, although nothing is misspecified. For hh-step errors, either apply the diagnostic to the one-step errors of the same procedure or test only lags hh and beyond with a variance that allows for the MA(h−1)(h-1) structure.

For a correctly specified conditional-mean model, systematic residual correlation with an available predictor reveals a potential repair. The predictor must have been observable at the origin. Regressing historical forecast errors on realized future weather may explain mistakes retrospectively while supplying no feasible real-time forecasting method.

Execute a matched comparison

The lecture’s code simulates an AR(1) with coefficient 0.8 and evaluates four-step forecasts after an initial 120 observations. It refits an intercept and persistence coefficient at every origin. The naive competitor holds the latest observed value for all four steps. Both methods forecast the same targets.

The shared realization gives an AR RMSE of about 1.530 and a naive RMSE of about 1.760. The mean difference in squared loss favors the fitted AR procedure on this realization. This is a conditional teaching result, not a claim that autoregressions always dominate naive forecasts.

The code reports a Ljung–Box statistic of Q(8)≈224Q(8)\approx224 for the four-step errors, as the overlap predicts, and Q(8)≈5.0Q(8)\approx5.0 for the one-step errors of the same rolling procedure, which gives no evidence against the specification. It also reports the paired squared-loss statistic with three Bartlett lags, about −2.49-2.49. Because the comparison is nested and the window expands, comparing that value with ±1.96\pm1.96 is not justified by the results above; read it as a standardized description of the loss difference.

The code also checks a plug-in interval using the generating process variance while the point forecast uses estimated coefficients. Its label explicitly describes the known-parameter variance component. The resulting coverage is diagnostic, not an exact nominal-coverage theorem for the estimated procedure. Change the sample length and persistence to see where ignoring estimation uncertainty becomes more consequential.

Deliberately fit once using the entire series, then use those coefficients at every earlier origin. Compare the apparent performance with the chronological version. The size of the distortion will depend on the sample. Repair the procedure by moving all fitting and transformation steps inside the origin loop. Finally mutate every observation after a chosen origin and confirm that the retained earlier forecast remains unchanged.

Worked problem and assignment preparation

At an origin with 100 training observations, a model produces four forecasts. The first targets t+1t+1 and the last targets t+4t+4. If your evaluation table labels them all with origin tt, how should you join actuals? Join the first to period t+1t+1, the second to t+2t+2, and so forth, keeping both origin and target period. One actual can be the target of forecasts issued at several different origins. Those are distinct forecasting tasks.

Suppose A has squared losses (1,9,4)(1,9,4) and B has (4,4,9)(4,4,9) on the same three targets. Their mean losses are 14/314/3 and 17/317/3, so the paired mean difference is −1-1. The three differences are (−3,5,−5)(-3,5,-5); the ranking reverses on the second target. A report should show that heterogeneity, identify the decision’s important regimes, and avoid treating three observations as strong evidence of universal superiority.

For the first concept check, be prepared to derive an AR forecast, identify an inadmissible input, and interpret a loss comparison. For Project 1, retain a forecast table with an explicit origin-target relationship and an unaltered benchmark. The project is now a reproducible decision procedure, not only a fitted model.

Further reading

See Forecasting: Principles and Practice on point accuracy and residual diagnostics. Its forecasting with dynamic regression explains why future regressors also require forecasts. For paired-loss inference, read Diebold and Mariano (1995), West (1996), Clark and McCracken (2001), and Giacomini and White (2006).

Lecture 5

Signals, noisy measures, and information-preserving filters

Does a cleaner-looking series preserve the information available at the decision date?

The economic quantity and its indicator

Suppose StS_t is an economic quantity of interest and the recorded indicator is

Yt=St+νt.Y_t=S_t+\nu_t.

The measurement disturbance νt\nu_t may represent reporting noise, sampling variation, a changing collection instrument, or an imperfect operational definition. Calling it measurement error does not imply it is independent of StS_t, independent over time, mean zero, or constant in variance. Each of those is an additional assumption.

Under the elementary assumptions of zero-mean noise independent of the signal, Var⁡(Yt)=Var⁡(St)+Var⁡(νt)\operatorname{Var}(Y_t)=\operatorname{Var}(S_t)+\operatorname{Var}(\nu_t). If noise is also independent across dates, positive-lag covariance of YY equals that of SS, while the lag-zero variance is larger. Consequently observed autocorrelations are attenuated toward zero:

ρY(k)=ρS(k)Var⁡(St)Var⁡(St)+Var⁡(νt),k>0.\rho_Y(k)=\rho_S(k)\frac{\operatorname{Var}(S_t)}{\operatorname{Var}(S_t)+\operatorname{Var}(\nu_t)},\qquad k>0.

A less persistent observed indicator can therefore measure a persistent latent quantity noisily. That explanation competes with a genuinely less persistent underlying process. One noisy indicator alone may not identify both components without additional structure.

Averaging trades noise reduction against responsiveness

Consider a trailing three-period average,

Y~t=Yt+Yt−1+Yt−23.\widetilde Y_t=\frac{Y_t+Y_{t-1}+Y_{t-2}}3.

If the measurement disturbances are independent with variance rr, their average contributes r/3r/3 to this filtered measure’s variance. But the signal component becomes (St+St−1+St−2)/3(S_t+S_{t-1}+S_{t-2})/3, which is not generally equal to StS_t. Noise reduction is purchased by averaging across potentially changing states.

For a deterministic ramp St=a+btS_t=a+bt, the trailing average is a+b(t−1)a+b(t-1). It lags the current state by bb. For a sudden jump, it adjusts over three observations. A lower variance does not establish a better estimate of the current quantity when responsiveness matters to the decision.

Serially correlated measurement disturbances reduce the noise benefit. In general,

Var⁡(νt+νt−1+νt−23)=3r+4γν(1)+2γν(2)9.\operatorname{Var}\left(\frac{\nu_t+\nu_{t-1}+\nu_{t-2}}3\right) =\frac{3r+4\gamma_\nu(1)+2\gamma_\nu(2)}9.

The same covariance counting used for temporal aggregation applies. With perfectly persistent noise, averaging does not eliminate it. If a reporting instrument changes, the filtered series can blur a measurement break into an apparent economic transition.

Filtering and smoothing use different information

A filter estimates a current or past state using information available up to its stated decision date. A smoother estimates a historical state using observations after that historical date. Both can be useful. Their outputs answer different questions.

A centered five-period moving average is

Y‾t=Yt−2+Yt−1+Yt+Yt+1+Yt+25.\overline Y_t=\frac{Y_{t-2}+Y_{t-1}+Y_t+Y_{t+1}+Y_{t+2}}5.

It uses two future observations. It may describe a historical pattern more symmetrically than a trailing average, but it was unavailable at date tt. At the end of a sample, the centered measure cannot be computed without padding, extrapolation, or shortening the window. Each choice changes the endpoint behavior.

The distinction becomes especially important when constructing regressors. If a forecasting model uses the centered measure at the historical origin, it imports future outcomes through preprocessing. The regression formula may contain only variables labeled tt; the information violation is hidden inside their construction.

Seasonal adjustment and benchmark revisions can have similar effects. A series released as a current indicator can be revised after future observations arrive. The latest adjusted history is useful for retrospective analysis but may not be the measure available to an earlier forecaster. Preserve the vintage or qualify the experiment.

The Hodrick–Prescott filter, a widely used trend extraction in macroeconomics, is a two-sided smoother of this kind. Its trend at date tt depends on observations after tt, so the estimate near the end of a sample changes as later data arrive, and a cyclical gap computed from the full sample was not available to a forecaster at the time. Hamilton (2018) documents these endpoint revisions and the spurious dynamics the filter can create, and proposes a regression on lagged values in its place. Applying the future-mutation test below to an HP trend would expose the problem directly.

A future-mutation test

An algorithm producing S^t∣t\widehat S_{t|t} should satisfy a useful implementation invariant: replacing observations after tt must not change that output, when its fitted parameters and past information are held fixed. Formally, if two datasets agree through tt, an admissible fixed-parameter filter gives the same value at tt on both.

This condition is necessary for the asserted information restriction. It is not sufficient for a good estimator. A constant forecast passes the mutation test while potentially wasting nearly all available information. A procedure may also leak through full-sample estimated parameters even if its final filtering recursion is one-sided. Audit both parameter fitting and state updating.

In the laboratory, a latent AR(1) signal is observed with independent noise. We calculate a trailing three-period mean and a centered five-period mean. Then we add 100 to every observation after index 120. The trailing value at 120 changes by zero. The centered value changes by 40, because two of its five inputs have increased by 100.

The exact 40-unit change is an arithmetic diagnostic of future dependence. It does not rely on a significance test. The two filters have different window lengths, so their noise performance should not be treated as a controlled comparison of centering alone. The experiment’s primary purpose is to expose their information sets. For a controlled comparison of window placement, use equal-length trailing and centered windows and retain the same output target.

Measurement composition can resemble a dynamic change

Let Yt=∑iwi,tXi,tY_t=\sum_i w_{i,t}X_{i,t}. Between dates,

Yt−Yt−1=∑iwi,t−1(Xi,t−Xi,t−1)+∑i(wi,t−wi,t−1)Xi,t.Y_t-Y_{t-1} =\sum_iw_{i,t-1}(X_{i,t}-X_{i,t-1}) +\sum_i(w_{i,t}-w_{i,t-1})X_{i,t}.

The first term reflects within-unit changes using previous weights. The second reflects changing composition evaluated at current values. This decomposition is an accounting identity; it assigns the interaction term according to the chosen timing convention. A different convention can allocate that interaction differently without changing the total.

An aggregate wage can rise when low-wage workers leave the observed sample even if nobody receives a wage increase. A regional temperature index can change when station inclusion changes. A network index can change when links are redefined. A model that treats every aggregate movement as a shock to a fixed population misinterprets the variable it observes.

Record the weight rule and test a fixed-composition series when feasible. Compare the results before deciding whether the dynamics changed. A repaired measurement specification may be more valuable than a larger autoregressive model.

What can be learned from multiple indicators?

If two indicators measure the same state with independent noises, their shared variation can help isolate the state. For example, Y1t=St+ν1tY_{1t}=S_t+\nu_{1t} and Y2t=λSt+ν2tY_{2t}=\lambda S_t+\nu_{2t} imply Cov⁡(Y1t,Y2t)=λVar⁡(St)\operatorname{Cov}(Y_{1t},Y_{2t})=\lambda\operatorname{Var}(S_t) under the independence assumptions. Identifying the scale requires a normalization or an external unit definition.

A principal component can summarize shared variation, but its weights maximize a statistical criterion. They do not automatically define an economically valid measure. The sign is arbitrary; the scale depends on normalization; standardizing indicators changes the criterion. If a component is used for forecasting, estimate its transformations and weights on the training sample and freeze them at the origin.

The core course uses explicit small measurement systems so these assumptions can be inspected. Lecture 8 develops a scalar state-space filter with specified variances. Estimating high-dimensional factors or unrestricted state-space systems belongs to an extension after the basic information and identification issues are understood.

Execute and revise the measurement specification

Run ch05. The synthetic realization’s raw indicator error relative to its known state has an RMSE near 1.003; the trailing mean’s error is near 0.931. This improvement is specific to the chosen signal persistence, noise variance, and sample. Increase the speed of signal movement or reduce measurement noise; averaging can become less useful. Keep the output target fixed as the current state while changing those conditions.

At a chosen date, record the raw value, filtered value, uncertainty claim, and admitted observations. Apply the future-mutation test. Then inspect the source to verify the exact input indices. Draw the window on a timeline; that drawing should agree with the code in every language.

For Project 1’s prototype freeze, submit the measurement specification along with the model. An auditor should be able to reconstruct the target and each regressor from documented inputs. A cleaner graph is insufficient evidence of a better measurement process.

Worked problem

Suppose a true state follows St=0.8St−1+ηtS_t=0.8S_{t-1}+\eta_t, where Var⁡(η)=0.36\operatorname{Var}(\eta)=0.36, and independent measurement noise has variance 1. The stationary state variance is 0.36/(1−0.64)=10.36/(1-0.64)=1. The state lag-one covariance is 0.8, while observed variance is 2. Hence observed lag-one correlation is 0.4. Fitting a simple AR(1) directly to the observed series can produce a coefficient much smaller than the latent persistence.

Now suppose the true state rises exactly two units per period and noise is absent. A trailing three-period average is two units below the current state. Its graph is smoother only in a trivial sense: it is an equally straight line displaced in time. A decision requiring the current state should account for that delay.

The measurement ledger should specify which quantity is latent, what the observed indicator contains, which assumptions permit separation, and whether the reported estimate is filtered or smoothed. Those statements prepare the state-space argument without requiring a complex estimator yet.

Further reading

QuantEcon’s Linear State Space Models connects latent states to observed variables. Hamilton (2018) examines the information problems of the Hodrick–Prescott filter. NOAA’s geographic climate series provide an applied setting in which spatial definitions matter.

Lecture 6

Trends, unit roots, and misleading level regressions

Will a shock decay, or permanently change the path?

Two rising series can have different mechanisms

A deterministic-trend model is Yt=a+bt+UtY_t=a+bt+U_t, where UtU_t is stationary. A stochastic-trend model is Yt=Yt−1+d+εtY_t=Y_{t-1}+d+\varepsilon_t. Their graphs can both rise. Their responses to a shock differ fundamentally.

In the first model, a disturbance to stationary UtU_t eventually fades under stable dynamics and the series returns toward its deterministic path. In the second, a shock permanently changes the level of every future path. Subtracting a fitted line removes a deterministic trend under its assumptions; it does not eliminate the accumulated innovations of a random walk.

For the random walk, iteration gives Yt+h=Yt+hd+∑j=1hεt+jY_{t+h}=Y_t+hd+\sum_{j=1}^h\varepsilon_{t+j}. Its conditional forecast is Yt+hdY_t+hd, and its known-parameter error variance is hσ2h\sigma^2. The forecast’s uncertainty grows with the horizon. A stable AR forecast’s variance instead approaches a finite limit.

If a series is stationary after one difference but not stationary in levels, we call it integrated of order one, I(1)I(1), subject to the stated definition and regularity conditions. An I(0)I(0) series has stationary behavior in the relevant sense. Integration order is a statement about a process; finite-sample tests provide evidence about that statement, not certainty.

Differencing removes a unit root and can create dependence

Define ΔYt=Yt−Yt−1=(1−L)Yt\Delta Y_t=Y_t-Y_{t-1}=(1-L)Y_t. A random walk with drift satisfies ΔYt=d+εt\Delta Y_t=d+\varepsilon_t. The accumulated stochastic trend disappears, leaving innovations and drift.

Differencing an already stationary white-noise series produces ΔYt=εt−εt−1\Delta Y_t=\varepsilon_t-\varepsilon_{t-1}, an MA(1) with coefficient −1-1 under our sign convention. Its variance is 2σ22\sigma^2 and its lag-one correlation is −1/2-1/2. The root lies on the invertibility boundary. Over-differencing can therefore manufacture a distinctive negative correlation and increase noise.

An ARIMA(p,d,q)(p,d,q) specifies a stationary ARMA model for (1−L)dYt(1-L)^dY_t. Forecast the differenced series, then integrate predictions back to levels using the observed initial level. For d=1d=1, a multi-step level forecast is the current level plus the sum of forecast differences. Its error variance requires covariances among those future difference errors; summing only their separate variances can be wrong.

Seasonal differencing (1−L12)(1-L^{12}) targets a seasonal unit root. It is a different operation from subtracting seasonal dummy effects or Fourier terms. Combining ordinary and seasonal differences requires a substantive reason and diagnostics; the appearance of a repeating seasonal pattern alone does not prove a seasonal unit root.

The Dickey–Fuller regression

Begin with Yt=c+ϕYt−1+εtY_t=c+\phi Y_{t-1}+\varepsilon_t and subtract Yt−1Y_{t-1}:

ΔYt=c+δYt−1+εt,δ=ϕ−1.\Delta Y_t=c+\delta Y_{t-1}+\varepsilon_t, \qquad \delta=\phi-1.

The unit-root null is δ=0\delta=0; the stable positive-persistence alternative has δ<0\delta<0. A DF statistic is the fitted coefficient divided by its estimated standard error. Under the unit-root null, its distribution is not the usual regression Student distribution. The regressor accumulates innovations, and the asymptotics involve functions of a stochastic path.

Deterministic terms matter. A regression without a constant, with a constant, and with a constant plus trend have different null distributions. Do not move a critical value across these specifications. Choose deterministic terms from the economic question and maintained model, then retain the correct reference distribution.

The augmented Dickey–Fuller regression adds lagged differences:

ΔYt=c+bt+δYt−1+∑j=1pγjΔYt−j+ut.\Delta Y_t=c+bt+\delta Y_{t-1} +\sum_{j=1}^p\gamma_j\Delta Y_{t-j}+u_t.

The added terms address serial correlation under suitable conditions. Too few lags can leave dependence in utu_t; too many can reduce power. Record the lag-selection rule and inspect residuals. Repeatedly trying deterministic terms and lags until a desired rejection appears changes the testing exercise.

A failure to reject does not establish that the process has a unit root. Near-unit stationary processes are hard to distinguish from unit-root processes in a short sample. A rejection can also be sensitive to a level break, trend break, or measurement change. Use the test with economic reasoning and later-target behavior.

The KPSS test of Kwiatkowski, Phillips, Schmidt, and Shin (1992) reverses the roles of the hypotheses. Its null is stationarity around the chosen deterministic terms, and its alternative is a unit root. It regresses YtY_t on those terms, accumulates the residuals into partial sums St=∑s≤tu^sS_t=\sum_{s\le t}\widehat u_s, and compares T−2∑tSt2T^{-2}\sum_tS_t^2 with an estimate of the residuals’ long-run variance. Its null distribution is also nonstandard, it depends on the deterministic terms, and the long-run variance requires a bandwidth choice. Reading the two tests together is informative. When the ADF test rejects and KPSS does not, the evidence favors stationarity; when KPSS rejects and the ADF test does not, it favors a unit root. When both reject or neither does, the sample has not settled the question, and a near-unit root, a break, or an unsuitable bandwidth are candidate explanations.

A finite-sample simulation of the test

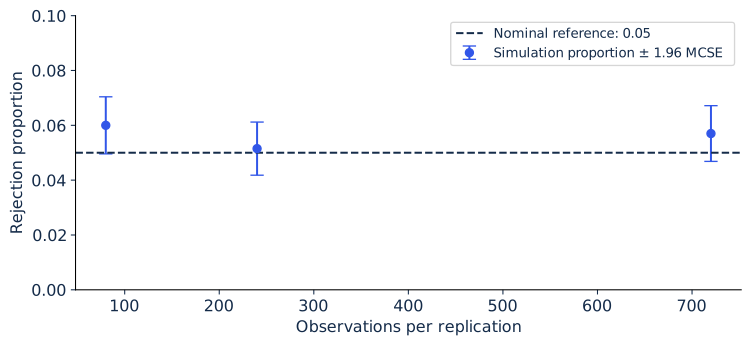
The laboratory generates independent unit-root paths under a specified simple null: zero-drift Gaussian random walks initialized at zero. It fits a DF regression with an intercept, no trend, and no augmented lags. For sample sizes 80, 240, and 720, it repeats the experiment 2,000 times and records the proportion of statistics below −2.86-2.86.

That threshold is an approximate conventional large-sample 5% reference for the intercept specification. This simulation does not create a calibrated finite-sample critical value for every application. Its purpose is to reveal the sampling variation in a claimed rejection rate and the effect of sample size under this specific data-generating process.

Independent replications require independent draws, and the way a simulation is seeded can remove that independence without any visible error. The laboratory takes every path from one Park–Miller stream with a single documented seed and splits the stream into consecutive blocks of nn draws. An earlier version of this laboratory reseeded replication ii with 515+i515+i, and that scheme fails. The generator is multiplicative, so consecutive seeds produce first uniforms that differ by only 48271/(231−1)48271/(2^{31}-1). Over the 200 former replications, the first Box–Muller pair therefore always had a radius between 2.87 and 2.99, while its angle advanced by about 0.53 radians from one seed to the next. Across replications, the first two innovations each had a standard deviation of 2.07 instead of 1. The DF statistic with an intercept does not depend on the first draw of a path, but it does depend on the second, which had about four times its intended variance. Rejection rates computed that way therefore described a walk whose second step had the wrong distribution, drawn in replications that were not independent. Another base seed does not repair the scheme: seeds 2026+i2026+i over 2,000 replications give a first-draw standard deviation of 1.64. The code now records the standard deviation of the first draw across replications, which should be close to one, and the verification suite fails when it is not.

If p^\widehat p is a Monte Carlo rejection proportion from RR independent replications, its approximate simulation standard error is

MCSE⁡=p^(1−p^)R.\operatorname{MCSE}=\sqrt{\frac{\widehat p(1-\widehat p)}R}.

With 2,000 replications, a proportion near 0.05 has an MCSE of about 0.005; with 200 replications it would be about 0.015, and differences of a few percentage points would be simulation noise. Increasing observations per replication and increasing replications address different uncertainties. The former changes the statistical experiment; the latter improves how accurately the simulation describes it.

The shared baseline produces rejection rates of 0.060, 0.0515, and 0.057 at n=80n=80, 240, and 720, each with an MCSE of about 0.005. The reference script repeats the design with 200,000 replications from NumPy’s generator and obtains 0.054, 0.052, and 0.050, with MCSEs near 0.0005. Each course rate lies within 1.3 of its Monte Carlo standard errors of the corresponding reference rate. The small excess over 0.05 at 80 observations is a genuine finite-sample effect: −2.86-2.86 is an asymptotic critical value, and the 5% critical value for a sample of that length is slightly more negative. The differences among the course’s three rates are within simulation noise and say nothing about how size varies with sample length.

Dickey–Fuller size at the −2.86 reference: rejection proportions from 2,000 replications per sample size, drawn from one stream, with approximate 95% Monte Carlo error bars.

Dickey–Fuller size at the −2.86 reference: rejection proportions from 2,000 replications per sample size, drawn from one stream, with approximate 95% Monte Carlo error bars.

Suppose Xt=Xt−1+vtX_t=X_{t-1}+v_t and Yt=Yt−1+utY_t=Y_{t-1}+u_t, with independent innovation sequences. Regressing YtY_t on a constant and XtX_t in levels can generate misleading conventional significance. Each regressor carries a highly persistent random path. Usual stationary-regression laws do not justify the familiar standard-error calculation.

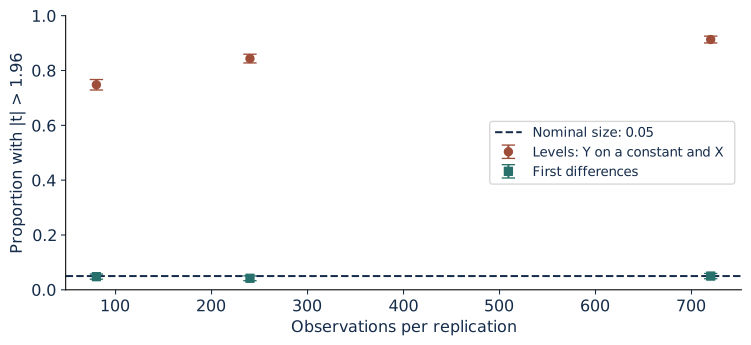
A single realization need not show the problem. The course’s baseline pair has a levels R2R^2 of about 0.0013 and a slope tt statistic of about 0.69. We retain that outcome, because the warning concerns the distribution of the procedure across many samples. The laboratory therefore repeats the experiment on 2,000 independent pairs of Gaussian walks for each sample size. The nominal 5% two-sided tt test of a zero slope in the levels regression rejects the true null in 74.8%, 84.4%, and 91.3% of replications at n=80n=80, 240, and 720, with MCSEs of 1.0, 0.8, and 0.6 percentage points. After differencing, the same test rejects in 4.8%, 4.2%, and 5.0% of replications, close to its nominal size. The reference script’s 200,000 replications give 73.7%, 84.8%, and 91.2% in levels and 5.4%, 5.0%, and 5.0% in differences.

The false-rejection rate rises with the sample. Granger and Newbold (1974) documented the phenomenon by simulation, and Phillips (1986) explained it: in the levels regression the slope estimate converges to a random variable, while the conventional tt statistic diverges at rate n\sqrt n. More data make the misleading inference more confident.

Proportion of 2,000 replications in which the nominal 5% t test rejects a zero slope for independent Gaussian random walks, in levels and in first differences, with approximate 95% Monte Carlo error bars.

Proportion of 2,000 replications in which the nominal 5% tt test rejects a zero slope for independent Gaussian random walks, in levels and in first differences, with approximate 95% Monte Carlo error bars.

Differencing this example gives independent innovations, restoring the intended simple regression setting. But differencing every economic pair indiscriminately can discard a genuine long-run relation. Lecture 11 will construct two I(1)I(1) series whose particular linear combination is stationary. Cointegration is the structured exception that must be investigated rather than assumed.

Execute, break, and repair

Run ch06 and inspect df_stat and unit_root_monte_carlo in the full source. Verify that the regression includes an intercept and that the reported statistic uses the lagged-level coefficient. Count the usable observations after differencing. The residual degrees of freedom are the number of usable rows minus the two fitted coefficients.

Deliberately compare the statistic with −1.96-1.96, the familiar normal threshold. Under this unit-root design, record how often that mistaken rule rejects. Restore the appropriate DF reference and compare. The repair changes the inferential rule; it does not change the fitted coefficient.

Next generate a deterministic trend plus a stable AR disturbance. Compare detrending and differencing using the correct target definition. Detrending estimates deviations from a deterministic path; differencing changes the series into period-to-period changes. Translate forecasts back into the original outcome units before comparing losses.

Finally add a known level break. Report how much the conclusions change when that break is represented explicitly. A unit-root decision should not be used to hide an obvious change in measurement or policy regime.

Worked problem and project audit

A random walk has drift 2, innovation variance 9, and current level 100. Its three-period forecast is 106 and its process-error variance is 27. A stable AR model with innovation variance 9 can also have a three-period variance near 27 when persistence is near one, but its long-horizon variance is finite if ∣ϕ∣<1|\phi|<1. Short-horizon similarity does not establish identical long-run behavior.

For a stationary white-noise series with variance 9, the differenced series has variance 18 and lag-one covariance −9-9. Its lag-one correlation is −0.5-0.5. Seeing this pattern after differencing is a reason to examine whether the transformation was needed.

During the prototype exchange, audit the partner’s choice of levels, differences, and deterministic terms. Identify what observation would challenge that choice. A defensible audit can conclude that the available sample does not resolve the distinction and recommend robust short-horizon benchmarks. It should not convert an inconclusive test into a confident declaration.

Sources

Dickey and Fuller (1979) derive unit-root estimator distributions. Kwiatkowski, Phillips, Schmidt, and Shin (1992) test the stationarity null. Granger and Newbold (1974) and Phillips (1986) analyze spurious regressions. The practical ARIMA framework is discussed in Forecasting: Principles and Practice.

Lecture 7

Weather, seasonality, and dynamic regression

Is the model using a feasible predictor or explaining the future after it happened?

An economic predictor does not eliminate temporal dependence

Monthly electricity demand depends on weather, calendar patterns, customer counts, and economic activity. An autoregression summarizes persistence without representing those mechanisms explicitly. Dynamic regression adds predictors while retaining a model for unexplained temporal variation:

Yt=xt′β+ηt,Φ(L)ηt=Θ(L)εt.Y_t=x_t'\beta+\eta_t, \qquad \Phi(L)\eta_t=\Theta(L)\varepsilon_t.

Here xt′βx_t'\beta represents the conditional regression component and ηt\eta_t is a serially correlated disturbance. It is useful to reserve εt\varepsilon_t for the innovation after that dependence is removed. Treating ηt\eta_t as independent white noise would misstate the uncertainty and waste potential forecasting information.

Different models can place dynamics in different locations. A regression on lagged outcomes and predictors is not generally identical to a static predictor relation with ARMA errors. Their coefficient interpretations and restrictions differ. Write the model in full before translating it to a package formula.

Exogeneity also needs specification. For unbiased or consistent regression estimates, the required relation between predictors and disturbances depends on the model and estimator. A weather variable may be plausibly external to electricity demand, but aggregate economic predictors can react to the same shocks as the outcome. A forecasting association does not establish a causal demand response.

Represent seasonal patterns economically

For monthly observations, deterministic seasonality can be represented by eleven month indicators plus an intercept, or by Fourier terms

sin⁡ ⁣(2πkt12),cos⁡ ⁣(2πkt12).\sin\!\left(\frac{2\pi kt}{12}\right), \qquad \cos\!\left(\frac{2\pi kt}{12}\right).

Low-order Fourier terms produce a smooth repeating annual pattern with fewer parameters. Month indicators allow a more flexible pattern at the cost of more coefficients. At the Nyquist frequency for an even seasonal period, the sine term is identically zero and should be omitted; redundant columns can make the design rank deficient.

Calendar regressors are known in advance. A forecast for next July can use July’s indicator at the origin. Actual next-July temperature is not known. This is an important difference between two variables both associated with seasonality.

A trend in customer count changes the scale of total demand. Modeling sales per customer answers a different question from modeling total sales with customer count as a predictor. If you transform the target, report forecasts and loss in the units the decision requires. A logarithm can improve scale behavior, but exp⁡(E[log⁡Y∣I])\exp(\mathbb E[\log Y\mid\mathcal I]) is a conditional median under common lognormal assumptions, not automatically the conditional mean of YY.

A nonlinear response to temperature

Heating and cooling mechanisms motivate a piecewise linear response. For a temperature measure TtT_t and reference T0T_0,

Ht=(T0−Tt)+,Ct=(Tt−T0)+,H_t=(T_0-T_t)_+,\qquad C_t=(T_t-T_0)_+,

with a regression component βHHt+βCCt\beta_HH_t+\beta_CC_t. Both slopes can be positive because unusually cold and unusually hot conditions can raise electricity demand through different uses. The threshold is a modeling choice; its interpretation depends on the measured temperature and the energy technology.

The synthetic experiment uses these transformations of a monthly temperature measure. In the observed Texas case, the same transformations are monthly-temperature proxies. They are not sums of daily heating and cooling degree days. A transformation of a monthly mean loses information about the within-month distribution; Lecture 1’s geographic example explains the same noncommutation issue across places.

The research by Chang, Kim, Miller, Park, and Park (2016) models the temperature distribution observed at a higher frequency and a functional demand response. It provides a substantive motivation for treating the distribution of exposure as economically relevant. The introductory piecewise regression here is a simpler teaching model. It does not reproduce that paper’s functional estimator or establish its empirical conclusions. Published article.

Remove an AR(1) error through a transformation

Take the special case

Yt=xt′β+ηt,ηt=ρηt−1+εt.Y_t=x_t'\beta+\eta_t,\qquad \eta_t=\rho\eta_{t-1}+\varepsilon_t.

Subtract ρ\rho times the lagged regression:

Yt−ρYt−1=(xt−ρxt−1)′β+εt.Y_t-\rho Y_{t-1} =(x_t-\rho x_{t-1})'\beta+\varepsilon_t.

With known ρ\rho, appropriate exogeneity, and constant innovation variance, this transformed regression removes the AR(1) disturbance dependence. The intercept column transforms from 1 to 1−ρ1-\rho; retaining a column of ones without accounting for this transformation changes the intercept parameterization.

With unknown ρ\rho, one feasible approach fits an initial regression, estimates an AR(1) on its residuals, and refits the transformed regression. This is a feasible GLS step. It need not be an exact likelihood estimate, and a single step need not reach the optimum of a joint fitting procedure. Its validity relies on the relevant assumptions and the consistency of the covariance estimate.

The code drops the first observation in the transformation. An alternative treatment can retain it with a stationary initial-state adjustment. Near a unit root, initial-condition handling matters more. Be explicit about which criterion and rows are used before comparing implementations.

Inspect the transformed innovations afterward. If their ACF retains a seasonal pattern, the AR(1) error model has not captured all residual dynamics. If squared innovations cluster, the conditional variance model may need revision. Increasing the mean-model order is not necessarily the correct repair for a variance problem.

Forecast predictors as well as outcomes

The hh-step forecast combines a regression prediction and an error forecast:

Y^t+h∣t=x^t+h∣t′β^+η^t+h∣t.\widehat Y_{t+h|t}=\widehat x_{t+h|t}'\widehat\beta +\widehat\eta_{t+h|t}.

Known calendar inputs can be inserted directly. Uncertain weather and economic inputs require forecasts, scenarios, or a model that uses only available lags. A prediction conditioned on a stated hot-weather scenario is legitimate; labeling it as an unconditional forecast with realized future weather would misrepresent the information set.

Uncertain predictors contribute to outcome uncertainty. In a simple setting with fixed coefficients and a predictor forecast error vv, the variance contribution is β′Var⁡(v)β\beta'\operatorname{Var}(v)\beta, plus any relevant covariance with the outcome’s disturbance. Ignoring that term produces overly narrow intervals when weather uncertainty is important.

The code’s hot and cold scenario values compare regression levels at fixed Fourier coordinates. They omit an added forecast of the current residual state and do not assert a future weather probability. Their names explicitly identify them as scenarios. To create a full operational forecast, add the admissible error-state forecast and define the predictor information rule.

Execute, break, and repair

Run ch07. Its declared generating slopes are 0.8 for heating exposure and 1.2 for cooling exposure, and its error persistence is 0.6. The shared realization estimates error persistence near 0.62. Feasible GLS produces slopes near 0.781 and 1.242. These results recover the broad response in this controlled setting while retaining finite-sample deviations.

Examine the source’s design matrix. Verify that the Fourier inputs are known calendar functions, that the intercept is transformed along with every other column, and that the same rows enter both sides of the transformed regression. Compare the innovation ACF before and after the repair. A small remaining lag-one value is encouraging for this simulation but is not proof of independence.

Break the procedure by adding actual future temperature to a historical forecast without a scenario label. Apply the origin’s availability rule and identify the inadmissible input. Repair it by using a declared seasonal temperature expectation, a separately evaluated weather forecast, or lagged predictors. Retain the resulting loss comparison even if performance worsens: an honest operational forecast can be less accurate than an impossible retrospective one.

Worked problem and audit connection

Let Yt=10+2Xt+ηtY_t=10+2X_t+\eta_t and ρ=0.5\rho=0.5. If (Yt,Yt−1)=(20,16)(Y_t,Y_{t-1})=(20,16) and (Xt,Xt−1)=(4,3)(X_t,X_{t-1})=(4,3), transformed outcome is 12 and transformed predictor is 2.5. The transformed intercept is 10(1−0.5)=510(1-0.5)=5, so the regression component is 5+2(2.5)=105+2(2.5)=10. The transformed innovation is 2. Keeping an untransformed intercept of 10 would produce the wrong decomposition.

Suppose the current fitted error is 3, its persistence is 0.5, and next month’s regression component under a stated weather scenario is 100. The one-step scenario forecast is 100+0.5(3)=101.5100+0.5(3)=101.5. At two steps, the residual-state contribution is 0.52(3)=0.750.5^2(3)=0.75. The scenario’s weather path must still be supplied separately.

For Project 2, distinguish a misspecified error process from a predictor-timing violation. Each calls for a different repair. A reviewer should identify the exact affected forecast origins, explain why the issue matters, and replicate the consequence using a controlled change.

Further reading

Forecasting: Principles and Practice on dynamic regression and forecasting with future regressors supply practical context. The temperature-distribution motivation comes from Chang and colleagues (2016).

Lecture 8

Estimating a latent state as observations arrive

How much should a new observation change our estimate of the economic state?

Write the state and observation mechanisms separately

A scalar state-space model is

St=ϕSt−1+ηt,Yt=St+νt,S_t=\phi S_{t-1}+\eta_t,\qquad Y_t=S_t+\nu_t,

where state innovations have variance qq and observation disturbances have variance rr. In the elementary Gaussian version, both disturbance sequences are independent over time and independent of each other. The model separates an evolving economic quantity from a noisy observation of it.

The core exercise treats ϕ,q,r\phi,q,r as given. Estimating all three adds identification, optimization, and initial-state questions. Those are useful extensions, but a working filter should first be understood with a transparent specified model. A smooth output alone cannot tell us whether its variance parameters are economically defensible.

If the state and observation share the same unit, qq and rr have squared units. A model with observation loading λ\lambda would require consistent scaling: Yt=λSt+νtY_t=\lambda S_t+\nu_t. The loading establishes how state units translate into indicator units. Without a normalization, latent scales can be arbitrary.

Predict the state before observing the new record

Let mt−1m_{t-1} be the filtered mean of St−1S_{t-1} and Pt−1P_{t-1} its filtered variance, conditional on observations through t−1t-1. The transition equation gives the prior prediction

at=ϕmt−1,Vt=ϕ2Pt−1+q.a_t=\phi m_{t-1},\qquad V_t=\phi^2P_{t-1}+q.

The observation prediction is also ata_t because the loading is one and observation noise has mean zero. Its prediction-error variance is Vt+rV_t+r. Define the observation innovation vt=Yt−atv_t=Y_t-a_t. This is an error in predicting the observed indicator; it is different from the unobserved state innovation ηt\eta_t.

The new observation contains information about the state because Cov⁡(St,Yt∣It−1)=Vt\operatorname{Cov}(S_t,Y_t\mid\mathcal I_{t-1})=V_t. Under Gaussian conditioning, the state update is

Kt=VtVt+r,mt=at+Ktvt,Pt=(1−Kt)Vt.K_t=\frac{V_t}{V_t+r},\qquad m_t=a_t+K_tv_t,\qquad P_t=(1-K_t)V_t.

The Kalman gain KtK_t is dimensionless and lies between zero and one when Vt≥0V_t\ge0 and r>0r>0. A noisy indicator gets a small weight; a precise indicator gets a large weight. The posterior mean is a weighted combination of the prior state estimate and the new observation.

The variance update follows from the same conditional-Gaussian formula: Pt=Vt−Vt2/(Vt+r)=Vtr/(Vt+r)P_t=V_t-V_t^2/(V_t+r)=V_tr/(V_t+r). It cannot exceed the prior variance. This is an analytic check that an implementation should preserve up to floating-point tolerance.

Check limiting cases

As r→∞r\to\infty, Kt→0K_t\to0, and the observation contributes almost nothing. As r→0r\to0 with positive prior variance, Kt→1K_t\to1, the filtered state approaches the observed value, and posterior variance approaches zero. If qq increases, the prior becomes less precise and the new observation generally receives more weight.

If ϕ=0\phi=0, the prior state does not depend on the previous filtered state. If q=0q=0, the state evolves deterministically from its initial uncertainty; repeated observations can progressively reduce uncertainty about that initial condition. Degenerate combinations require careful implementation to avoid division by zero or an unjustified stationary initialization.

For ∣ϕ∣<1|\phi|<1, a stationary prior variance is q/(1−ϕ2)q/(1-\phi^2). The supplied code initializes the previous state mean at zero and variance at this stationary value, then applies the transition before the first observation. That convention implies the same stationary prior variance at the first observation. A diffuse prior or an economically informed initial state is a different specification.

Handle a missing observation by skipping its update

If YtY_t is missing, the state still evolves. Calculate ata_t and VtV_t, then set mt=atm_t=a_t and Pt=VtP_t=V_t. There is no measurement update because no observation has arrived. Imputing Yt=0Y_t=0 would instead treat zero as a real observation and could pull the state sharply toward it.

A run of missing observations increases uncertainty toward the transition model’s unconditional variance when the stable model applies. In an application, missingness may itself be informative. A measurement system that fails preferentially during extreme events violates the simple missing-at-random interpretation. The filter recursion can handle a missing input computationally while the underlying statistical assumptions remain questionable.

The data clock still applies. If the observation describes period tt but arrives later, update the model when it becomes available, using a properly specified delayed-observation system if necessary. Merely labeling it tt does not authorize an earlier update. The scalar exercise assumes observations arrive in their sequence at the stated dates.

Retrospective smoothing uses the future

After observing the entire sequence through TT, a smoother estimates StS_t conditional on IT\mathcal I_T. Write its mean as mt∣Tm_{t|T} and its variance as Pt∣TP_{t|T}; in this notation the filtered quantities mtm_t and PtP_t are mt∣tm_{t|t} and Pt∣tP_{t|t}. The scalar Rauch–Tung–Striebel recursion starts from mT∣T=mTm_{T|T}=m_T and PT∣T=PTP_{T|T}=P_T and moves backward:

Jt=PtϕVt+1,mt∣T=mt+Jt(mt+1∣T−at+1),J_t=\frac{P_t\phi}{V_{t+1}}, \qquad m_{t|T}=m_t+J_t(m_{t+1|T}-a_{t+1}), Pt∣T=Pt+Jt2(Pt+1∣T−Vt+1).P_{t|T}=P_t+J_t^2(P_{t+1|T}-V_{t+1}).

The backward correction uses what later observations reveal about earlier states. Under the specified Gaussian model, conditioning on more observations weakly reduces state uncertainty. The code checks that each smoothed variance Pt∣TP_{t|T} is nonnegative and no larger than the corresponding filtered variance PtP_t. In the source, ms and Ps hold mt∣Tm_{t|T} and Pt∣TP_{t|T}.

A smoother can improve historical state estimation while being unavailable for a real-time decision at that historical date. This is the model-based counterpart to Lecture 5’s centered average. Use filtered states to evaluate an earlier decision; use smoothed states to describe a retrospective reconstruction with its later information set stated.

The innovation likelihood and its limits

With specified Gaussian parameters, observation innovations give a log-likelihood contribution

ℓt=−12[log⁡(2π)+log⁡(Vt+r)+vt2Vt+r].\ell_t=-\frac12\left[\log(2\pi)+\log(V_t+r)+\frac{v_t^2}{V_t+r}\right].

Summing over observed dates supplies a likelihood objective for parameter estimation. Missing dates contribute no observation density while still changing the state prediction. Optimizing this objective requires admissible variance parameters, an initial-state convention, and checks for local solutions.

The standardized innovations vt/Vt+rv_t/\sqrt{V_t+r} should have the assumed mean, variance, and dependence under a correctly specified model. Persistent correlation suggests missing state dynamics; unusual tails suggest a distributional mismatch; a variance shift can reflect a changing instrument or a changing state process. Estimating parameters does not eliminate the need to inspect these implications.

Known synthetic state, filter, and retrospective smoother. The shaded band uses the specified Gaussian filter variance; one observation is deliberately missing.

Known synthetic state, filter, and retrospective smoother. The shaded band uses the specified Gaussian filter variance; one observation is deliberately missing.

Execute and replicate independently

Run ch08. The generator uses ϕ=0.8\phi=0.8, q=0.25q=0.25, and r=1r=1, then deliberately removes one observation. The shared realization gives filter RMSE around 0.562 and smoother RMSE around 0.496 against the known simulated state. This comparison is possible because the simulation reveals its state; observed economic data generally do not.

The missing date’s filtered variance exceeds the preceding posterior variance. That result follows from skipping the update in this setting; the exact magnitude depends on parameters and prior uncertainty. Inspect the missing-value branch in every implementation and confirm it does not insert a zero observation.

Apply the future-mutation test by adding 10 to observations after index 180. The filter at 180 remains unchanged. The smoother at 180 changes materially because its later information changes. Freeze the parameter values during this comparison; otherwise a full-sample parameter refit can also change earlier filtered estimates.

Independently reproduce the first three updates by hand or in a short script before reading the implementation’s output. On the course’s audit day, protect time for this replication. A student who only reproduces the final graph has not demonstrated that the prediction and update steps are understood.

Worked update and project repair

Suppose the prior state mean is 10 and variance is 4, observation variance is 1, and the new indicator is 13. The gain is 4/(4+1)=0.84/(4+1)=0.8, the posterior mean is 10+0.8(3)=12.410+0.8(3)=12.4, and posterior variance is (1−0.8)4=0.8(1-0.8)4=0.8. The observation moves the state toward 13 but does not eliminate uncertainty.

If observation variance instead equals 16, the gain is 4/20=0.24/20=0.2, posterior mean is 10.6, and posterior variance is 3.2. The noisier observation contributes less information. If the observation is missing, the prior mean 10 and variance 4 remain the current estimate after the prediction step.

For Project 2, a measurement repair should state whether it changes the indicator, the state transition, the observation variance, or the admitted information. Do not replace a centered feature with a smoother and claim to have removed future dependence. An admissible repair must preserve the appropriate decision clock.

Sources

Kalman (1960) is the foundational filtering paper. Rauch, Tung, and Striebel (1965) derive the fixed-interval smoother. QuantEcon’s linear state-space lecture supplies a broader treatment.

Lecture 9

Multivariate dynamics and regional networks

Does another region's history add information about this region's future?

Let several outcomes evolve together

A vector autoregression allows each series to depend on the histories of all included series. For a two-region VAR(1),

(Y1tY2t)=(c1c2)+(a11a12a21a22)(Y1,t−1Y2,t−1)+(u1tu2t).\begin{pmatrix}Y_{1t}\\Y_{2t}\end{pmatrix} =\begin{pmatrix}c_1\\c_2\end{pmatrix} +\begin{pmatrix}a_{11}&a_{12}\\a_{21}&a_{22}\end{pmatrix} \begin{pmatrix}Y_{1,t-1}\\Y_{2,t-1}\end{pmatrix} +\begin{pmatrix}u_{1t}\\u_{2t}\end{pmatrix}.

The off-diagonal entries describe predictive cross-lags conditional on the system’s included history. The disturbances can be correlated contemporaneously, with covariance matrix Σ\Sigma. That correlation allows shared surprises; it does not identify their economic sources.

A vector can combine regional outcomes, economic indicators, or related financial prices. Every component must have a consistent time convention, transformation, and availability rule. Combining a monthly flow with a daily return by row position produces no meaningful multivariate system. Choose a common frequency and describe the aggregation or sampling rule.

Dimensional consistency is more demanding than in a univariate autoregression. If one component is in MWh and another is in dollars, a12a_{12} has MWh per dollar and a21a_{21} has dollars per MWh. Rescaling a series changes these coefficients while retaining the equivalent economic prediction when the entire system is transformed consistently.

Solve the matrix recursion

Write Yt=c+AYt−1+utY_t=c+AY_{t-1}+u_t. A stationary mean, when it exists, solves

μ=(I−A)−1c.\mu=(I-A)^{-1}c.

The centered process is Xt=AXt−1+utX_t=AX_{t-1}+u_t. Iterating gives

Xt+h=AhXt+∑j=0h−1Ajut+h−j.X_{t+h}=A^hX_t+\sum_{j=0}^{h-1}A^ju_{t+h-j}.

The forecast is μ+Ah(Yt−μ)\mu+A^h(Y_t-\mu) under the conditional-mean restrictions. Its known-parameter covariance is

Vh=∑j=0h−1AjΣ(Aj)′.V_h=\sum_{j=0}^{h-1}A^j\Sigma(A^j)'.

For h=1h=1, this equals Σ\Sigma. Each term is positive semidefinite when Σ\Sigma is, so the covariance accumulates valid nonnegative uncertainty. Covariance between forecast errors matters when the decision concerns a regional total or a portfolio. Summing individual variances without cross-covariances can understate or overstate that aggregate risk.

For an aggregate G=w′YG=w'Y, forecast-error variance is w′Vhww'V_hw. Its weights define the aggregate’s economic unit. A regional population-weighted average and a sum of regional sales are different objects even when they use the same underlying vector.

Stability depends on the system’s eigenvalues

The VAR(1) is stable when every eigenvalue of AA lies inside the unit circle, equivalently its spectral radius is less than one. Small diagonal entries alone are insufficient. Cross-lag feedback can create persistence or instability.

For example, A=(0.60.50.50.6)A=\begin{pmatrix}0.6&0.5\\0.5&0.6\end{pmatrix} has eigenvalues 1.1 and 0.1. Each own-lag coefficient is 0.6, but the common mode is explosive. In contrast, A=(0.60.150.050.5)A=\begin{pmatrix}0.6&0.15\\0.05&0.5\end{pmatrix} has eigenvalues inside the circle. A disturbance can move through cross-lags while the system remains stable.

For a VAR(p)(p), stack the current vector and its p−1p-1 lags into a companion state. Stability is a condition on that companion matrix. Checking only the separate lag matrices misses their joint dynamics. Some software reports inverse roots; verify its convention before deciding which side of the unit circle indicates stability.

An estimated system can be unstable in a finite sample even when the generating process is stable. If that occurs, diagnose the transformation, sample length, lag order, and possible integrated components. Do not silently clip eigenvalues and present the resulting forecasts as estimates from the original model.

Estimate the reduced-form system

For each date, the regressor row is [1,Yt−1′][1,Y_{t-1}']. Stack those rows into XX and subsequent vectors into YY. With identical regressors across equations, ordinary least squares estimates every equation:

B^=arg⁡min⁡B∥Y−XB∥F2.\widehat B=\arg\min_B\|Y-XB\|_F^2.

In our storage convention, the first row of BB is the intercept and the remaining block is A′A'. Transposing the block recovers the column-vector recursion. A transpose mistake can reverse directional interpretations while leaving dimensions deceptively plausible.

Estimate disturbance covariance as Σ^=U′U/(n−k)\widehat\Sigma=U'U/(n-k), where nn is the number of usable rows and kk the number of regressors per equation. An ML convention uses denominator nn; both are legitimate if their names and comparisons are consistent. The parallel code uses the residual-degrees-of-freedom convention. Consistency of these estimates rests on the stability condition above together with the ergodicity and innovation conditions discussed in Lecture 2.

Adding variables or lags quickly increases parameter count. A VAR with mm variables and pp lags has m(1+mp)m(1+mp) mean parameters. A short monthly sample cannot support an arbitrarily large network of unrestricted regressions. Keep the core system small and compare it with univariate benchmarks on matched origins. Choose pp inside the training window with an information criterion from Lecture 3, replacing log⁡σ^2\log\widehat\sigma^2 by log⁡det⁡Σ^\log\det\widehat\Sigma and counting every mean parameter.

Does another region’s history predict this one?

The lecture’s question has a standard name. Series 2 does not Granger-cause series 1, relative to the variables in the system, when the past of series 2 does not reduce the mean squared error of the optimal linear forecast of series 1 given the past of series 1 (Granger 1969). In the VAR(1) that is the restriction a12=0a_{12}=0; in a VAR(p)(p) it sets the coefficients on every lag of series 2 in the first equation to zero. When the system is stable, a Wald or FF test of those restrictions has its usual large-sample distribution under the conditions of the previous section. With integrated or cointegrated levels its limiting distribution can be nonstandard.

The name invites misreading. Granger causality is incremental predictability within the chosen information set. An omitted common factor, as in Lecture 10, can create it without any direct channel, and a genuine channel can fail to appear at the sampling frequency. The laboratory reports one Wald statistic for each excluded cross-lag. The estimates are a^12=0.089\widehat a_{12}=0.089 and a^21=0.103\widehat a_{21}=0.103, against generating values of 0.15 and 0.05, and the statistics are 3.98 and 4.99 against a 5% χ2(1)\chi^2(1) critical value of 3.84. Both tests reject, correctly, because both cross-lags are nonzero in the generating system; the larger estimate belongs to the smaller generating coefficient, a reminder of how noisy cross-lag estimates are at 600 observations.

A known network imposes structure

Suppose a network matrix WW is specified from an external economic definition: spatial neighbors, supply-chain links, or another documented connection. A simple network autoregression can impose

A=ρI+λW.A=\rho I+\lambda W.

This restriction uses two dynamic coefficients in place of an unrestricted m×mm\times m matrix. Its value depends on whether the network is meaningful for the economic mechanism. An arbitrary graph can impose a misleading restriction efficiently.

State whether rows or columns carry source weights, whether weights are normalized, whether self-links exist, and what a missing link means. With the column-vector convention here, (WY)i=∑jWijYj(WY)_i=\sum_jW_{ij}Y_j is the input arriving at region ii from source jj. Direction belongs in the definition, not merely the graphic.

Stability depends on the eigenvalues of ρI+λW\rho I+\lambda W. For a row-stochastic WW, one eigenvalue is one, so ∣ρ+λ∣<1|\rho+\lambda|<1 is a necessary restriction for that common mode. Other modes still require checking. If WW changes, the system’s stability and interpretation can change even with constant ρ\rho and λ\lambda.

The core network exercise uses a synthetic two-node connection with zero diagonal and unit cross-links. It is a teaching graph, not an estimated map of actual electricity transmission or regional economic causality. An observed regional VAR supplies predictive associations; a separately documented network supplies a hypothesized structure. Keep those roles distinct.

Execute, break, and repair

Run ch09. It simulates a stable two-series system with correlated innovations and estimates a reduced-form VAR(1). The realized cross-lag estimates differ from their generating coefficients, while the estimated spectral radius remains below one. Compute the fitted one-step prediction by multiplying the matrix manually and compare it with the code.

Then reorder the two columns and fit again. Permute the coefficient matrix back to the original ordering. The reduced-form predictions should represent the same system up to numerical tolerance. If they do not, check column indexing and the transpose convention before making an economic claim.

Break the model by replacing the coefficient matrix with the unstable example above. Iterate a deterministic initial disturbance with future innovations set to zero. Show the exploding common mode. Repair the interpretation by stating that this parameter set does not define the stable process assumed in the moment formulas. A stable replacement requires an economically justified constraint or a different model, not a cosmetic graph range.

Worked problem and audit verdict

Let A=(0.60.20.10.5)A=\begin{pmatrix}0.6&0.2\\0.1&0.5\end{pmatrix}, c=0c=0, and Yt=(10,20)′Y_t=(10,20)'. The one-step forecast is (10,11)′(10,11)'. The two-step forecast is A(10,11)′=(8.2,6.5)′A(10,11)'=(8.2,6.5)'. The first region’s own past contributes 6 to its one-step forecast and the second region’s past contributes 4. Those predictive contributions are not separately identified causal effects.

If Σ=(4119)\Sigma=\begin{pmatrix}4&1\\1&9\end{pmatrix}, the one-step error variance of the regional sum is 4+9+2(1)=154+9+2(1)=15. Ignoring the covariance would report 13. A covariance of −1-1 would instead give 11. The sign of shared surprises matters for an aggregate decision.

For the project audit, identify whether a regional comparison concerns prediction, network propagation under a maintained structure, or an identified intervention. The reduced-form VAR answers the first question. Lecture 10 adds assumptions needed for the latter two and shows why those assumptions cannot be read directly from an attractive impulse-response plot.

Sources

Sims (1980), Macroeconomics and Reality is a foundational VAR reference. Granger (1969) defines predictive causality. Statsmodels’ VAR documentation describes estimation and analysis conventions.

Lecture 10

What an impulse response can claim

Which assumptions turn an unexplained movement into an economic shock?

The disturbance is an unexplained movement

The reduced-form VAR is Yt=c+AYt−1+utY_t=c+AY_{t-1}+u_t, with Var⁡(ut)=Σ\operatorname{Var}(u_t)=\Sigma. Its disturbance is the movement that the included histories did not predict. It can combine several economic shocks, omitted variables, measurement disturbances, and a model’s misspecification.

A structural interpretation writes

ut=Bεt,E[εtεt′]=I.u_t=B\varepsilon_t,\qquad \mathbb E[\varepsilon_t\varepsilon_t']=I.

The structural shocks are normalized to unit variance and contemporaneously uncorrelated. Their impact matrix BB determines how each shock moves the observed variables immediately. The observed covariance supplies the restriction BB′=ΣBB'=\Sigma.

That restriction generally does not identify BB uniquely. In a two-variable system, BB has four entries while symmetric Σ\Sigma supplies three distinct covariance entries. Normalization is useful, but additional substantive restrictions are needed. Assigning a column the name “regional transmission shock” does not supply one of those restrictions.

Derive the response conditional on an impact matrix

In a stable centered VAR(1),

Xt=∑j=0∞Ajut−j=∑j=0∞AjBεt−j.X_t=\sum_{j=0}^{\infty}A^ju_{t-j} =\sum_{j=0}^{\infty}A^jB\varepsilon_{t-j}.

A unit structural shock in component jj at date tt has response AhBejA^hBe_j at horizon hh, holding other shocks at zero. At impact, the response is BejBe_j. At one period, it is ABejABe_j. Subsequent propagation follows the estimated reduced-form dynamics.

These are model-implied responses to a shock defined by BB. Their economic interpretation inherits the identification assumptions used to construct that matrix. A well-estimated AA and Σ\Sigma can coexist with an unresolved economic shock interpretation.

A response can also be estimated without iterating the fitted VAR. A local projection (Jordà 2005) regresses Yt+hY_{t+h} directly on YtY_t and any further lags, one regression for each horizon. In a VAR(1) the horizon-hh coefficient matrix estimates AhA^h, and post-multiplying it by an impact matrix gives the response to the corresponding shock. Plagborg-Møller and Wolf (2021) show that local projections and VARs with unrestricted lag lengths estimate the same population responses; in finite samples a VAR with few lags imposes more structure, which lowers variance and can add bias when the lag length is too short. The identification problem is unchanged: a local projection still needs BB or an external measure of the shock.

Shock normalization affects scale. A one-standard-deviation shock, a shock normalized to move the first variable by one unit, and a shock normalized to a one-percent policy change produce differently scaled responses. State the normalization and outcome units on every response graph. An apparently large cross-region response can reflect a large shock normalization rather than a stronger economic mechanism.

Cholesky decomposition chooses a recursive system

For a positive-definite Σ\Sigma, a lower-triangular Cholesky factor LL satisfies LL′=ΣLL'=\Sigma. Using B=LB=L imposes a recursive impact structure. In two variables,

L=(ℓ110ℓ21ℓ22).L=\begin{pmatrix}\ell_{11}&0\\\ell_{21}&\ell_{22}\end{pmatrix}.

The first variable does not respond immediately to the second structural shock; the second can respond immediately to both. This asymmetry is an identification assumption. It does not follow merely from placing the first variable first in a data file.

Reversing variable order produces a different recursive restriction. Both factorizations reproduce the same covariance after the appropriate permutation back to the original variables. Their impact responses can differ. Variable ordering is therefore part of the economic argument, not an innocuous plotting option.

In a monthly regional system, an immediate-zero restriction may be implausible if markets adjust within days. At a daily frequency, another timing restriction may be more plausible, but measurement and release timing become more demanding. Identification should match the time interval over which “immediate” is defined.

Orthogonal rotations expose the ambiguity

Let QQ be any orthogonal matrix, so QQ′=IQQ'=I. If BB is a valid covariance factor, then

(BQ)(BQ)′=BQQ′B′=BB′=Σ.(BQ)(BQ)'=BQQ'B'=BB'=\Sigma.

An entire family of impact matrices therefore agrees with the same reduced-form covariance. In two dimensions, a rotation can be written

Q(ω)=(cos⁡ω−sin⁡ωsin⁡ωcos⁡ω).Q(\omega)=\begin{pmatrix}\cos\omega&-\sin\omega\\\sin\omega&\cos\omega\end{pmatrix}.

Changing ω\omega changes the mixture called each shock while preserving covariance. If the reduced-form disturbances are jointly Gaussian, covariance-preserving orthogonal rotations also preserve their Gaussian distribution. Additional non-Gaussian distributional structure can supply different identifying information, but it must be specified and defended.

This calculation is a counterexample to the claim that a positive-definite covariance matrix uniquely reveals economic shocks. It is exact linear algebra. More observations can estimate Σ\Sigma more precisely; they do not remove this unrestricted rotation by themselves.

Common shocks and network propagation can look similar

Two regions may move together because a disturbance propagates through economic links. They may also respond to a common national shock, share measurement practices, or react to an omitted input. Predictive cross-lags alone do not resolve these alternatives.

A known network matrix can impose economically meaningful structure, but the network needs its own provenance. Geographic adjacency is not necessarily an electricity-transmission relationship; a trade link is not necessarily a causal channel at the chosen frequency. A network based on contemporaneous outcome correlations can also encode the same common shocks it is being used to explain.

Consider an omitted common factor FtF_t affecting both regions with persistence. Each region’s lagged outcome can predict the other’s future because it contains information about FtF_t. An unrestricted VAR may report cross-lags even when there is no direct region-to-region transmission. A causal claim requires a strategy separating the shared factor from the hypothesized channel.

Useful identifying information can come from institutional timing, externally measured shocks, instruments, sign restrictions, or restrictions on long-run effects. Each introduces assumptions beyond the reduced-form fit. The course’s core exercise does not estimate all these methods; it equips you to state what an identified method must add and what evidence could challenge it.

Statistical and identification uncertainty are different

Sampling uncertainty concerns how estimated responses vary across samples under a maintained model and identifying restriction. A residual bootstrap can estimate that variation if its resampling scheme respects the assumed disturbance structure and refits the full procedure. Near instability, small samples, and model selection complicate the approximation.

Identification uncertainty concerns the different responses compatible with credible alternative restrictions. A narrow sampling band around a Cholesky response does not show that its ordering is correct. Report sensitivity to plausible orderings or other admissible restrictions alongside sampling uncertainty. If the key substantive conclusion changes across those alternatives, the economic claim should narrow.

Forecasting can remain useful even when structural identification is unresolved. A predictive system may support reserve planning while being insufficient to estimate the effect of an intervention. The model’s action recommendation should match the evidence it supplies.

Execute the covariance counterexample

Run ch10. The source fits the same synthetic two-variable VAR as Lecture 9. It obtains a lower-triangular factor, reverses the variable order and factors again, then constructs a rotation by angle 0.5 radians. All three impact matrices reproduce the same reduced-form covariance to numerical tolerance.

The first recursive ordering produces a nonzero immediate response of the second variable to the first shock. Under the reversed recursive restriction, that corresponding impact is zero. The rotated factor yields a third value. Those discrepancies are the experiment’s point: covariance agreement does not imply agreement about economic shock effects.

The code also estimates the four-period response of the second variable to the first Cholesky shock in two ways. Iterating the fitted VAR gives 0.116; a local projection with the same impact matrix gives 0.063. The generating system’s value is 0.087. Both estimators target that number and both miss it in this single sample, so one realization cannot rank them; comparing their dispersion would require repeated samples.

The code asserts covariance reconstruction for both recursive factorizations. Inspect those tests before inspecting the response values. A failed reconstruction indicates a computational error; successful reconstruction followed by different responses indicates the identification ambiguity we intended to demonstrate.

Break a causal story and repair the claim

Write a paragraph interpreting the first Cholesky shock as an intervention in region one. State the immediate exclusion restriction needed for that interpretation. Then reverse the ordering and retain the same reduced-form data. Identify which sentence in the original paragraph is no longer supported.

Repair the paragraph in one of two defensible ways. Supply credible external identifying information and state its assumptions, or narrow the paragraph to a model-based predictive response under a declared recursive ordering. A repair that merely changes the plotted color or shock label has not addressed identification.

For the audit verdict, separate replication errors, information violations, and unidentified causal claims. A partner can have executable code and honest forecasts while overinterpreting a response. Your evidence should identify that precise problem and its consequence for the proposed action.

Worked decomposition

Suppose Σ=(4225)\Sigma=\begin{pmatrix}4&2\\2&5\end{pmatrix}. A lower-triangular factor is L=(2012)L=\begin{pmatrix}2&0\\1&2\end{pmatrix}, because LL′=ΣLL'=\Sigma. Under this ordering, the first unit-variance shock moves variable one by 2 and variable two by 1 immediately. The second moves only variable two, by 2.

Rotate by 90 degrees using Q=(0−110)Q=\begin{pmatrix}0&-1\\1&0\end{pmatrix}. The new factor is LQ=(0−22−1)LQ=\begin{pmatrix}0&-2\\2&-1\end{pmatrix}. Its covariance remains Σ\Sigma, but its first shock has a completely different impact pattern. This rotation is an algebraic demonstration, not a recommendation to identify shocks arbitrarily.

Your ledger should retain the shock definition, normalization, identifying restriction, plausible alternative, and the decision that remains defensible under that alternative. Lecture 11 turns to a different multivariate restriction: a stable long-run combination of individually integrated variables.

Sources

Sims (1980) motivates the distinction between a system’s estimated dynamics and economic restrictions. Jordà (2005) introduces local projections, and Plagborg-Møller and Wolf (2021) relate them to VAR responses. Kilian and Lütkepohl (2017) survey structural VAR identification. The Statsmodels impulse-response documentation states its default Cholesky convention and covariance-factor requirement.

Lecture 11

A stable relation between moving levels

Can two wandering prices have a stable spread?

Integrated levels can share a stationary combination

Let XtX_t be a random walk and let ZtZ_t be stationary. Define

Yt=βXt+Zt.Y_t=\beta X_t+Z_t.

Both XX and YY can be I(1)I(1), yet Yt−βXt=ZtY_t-\beta X_t=Z_t is I(0)I(0). The vector is cointegrated: a particular linear combination removes the shared stochastic trend. This is a restriction on joint behavior that is absent from the independent random walks in Lecture 6.

An economically motivated spread can arise between related prices, exchange-rate components, or quantities connected by a long-run accounting or adjustment relation. The economic reasoning proposes a candidate relation; the data and model assumptions determine whether it is credible. A high level-regression R2R^2 alone does not establish cointegration.

Units matter. If YY and XX have different units, β\beta converts units so the spread is defined coherently. In log-price models, the coefficient may describe proportional long-run movement. A coefficient estimated on nominal values can change when currency units change even though the equivalent relationship remains intact.

Derive an error-correction model from a controlled mechanism

Suppose

Xt=Xt−1+vt,Zt=ρZt−1+ηt,∣ρ∣<1,X_t=X_{t-1}+v_t, \qquad Z_t=\rho Z_{t-1}+\eta_t, \qquad |\rho|<1,

and Yt=βXt+ZtY_t=\beta X_t+Z_t. Subtract lagged YY:

ΔYt=βΔXt+(ρ−1)Zt−1+ηt.\Delta Y_t=\beta\Delta X_t+(\rho-1)Z_{t-1}+\eta_t.

Replace Zt−1Z_{t-1} by Yt−1−βXt−1Y_{t-1}-\beta X_{t-1}:

ΔYt=α(Yt−1−βXt−1)+βΔXt+ηt,α=ρ−1.\Delta Y_t=\alpha(Y_{t-1}-\beta X_{t-1}) +\beta\Delta X_t+\eta_t, \qquad\alpha=\rho-1.

This is an error-correction representation. A positive spread predicts a decline in YY relative to the shared trend when α<0\alpha<0. The lagged deviation supplies information lost by a regression containing only changes.

The derivation also supplies a stability restriction. Here ρ=1+α\rho=1+\alpha, so ∣1+α∣<1|1+\alpha|<1, or −2<α<0-2<\alpha<0, makes the spread stable. A negative adjustment coefficient alone is insufficient: α=−3\alpha=-3 implies ρ=−2\rho=-2, an explosive alternating deviation. An adjustment coefficient between −1-1 and zero gives monotone mean reversion; between −2-2 and −1-1 gives oscillating mean reversion in this simple setting.

In a general multivariate system, several variables can adjust to the deviation. Then the relevant stability condition involves the combined adjustment and cointegrating vectors, not only one equation’s coefficient. Keep the scalar example’s restriction within the model from which it was derived.

The long-run and short-run coefficients need not match

The constructed mechanism makes the coefficient on ΔXt\Delta X_t equal to the long-run coefficient β\beta. A more general single-equation ECM is

ΔYt=c+α(Yt−1−a−βXt−1)+∑jγjΔYt−j+∑jδjΔXt−j+ut.\Delta Y_t=c+\alpha(Y_{t-1}-a-\beta X_{t-1}) +\sum_j\gamma_j\Delta Y_{t-j} +\sum_j\delta_j\Delta X_{t-j}+u_t.

Its short-run response coefficients need not equal the long-run relation. Additional lags can represent delayed adjustment, while deterministic terms specify the equilibrium relation and drift. Define whether an intercept or trend belongs inside the cointegrating combination or outside it in the change equation; those choices impose different restrictions.

An equilibrium error is a model-defined deviation, not proof that market forces must eliminate it profitably. Transaction costs, structural changes, and unmodeled risk can affect both the relation and the interpretation. A stable statistical spread does not automatically create a tradable strategy after costs.

Estimate carefully and use the correct residual test

A basic two-step procedure estimates a long-run level relation and then uses its residual in an ECM. Under cointegration and suitable assumptions, the level slope has a distinctive convergence rate. Familiar stationary-regression standard errors are not automatically valid for every inferential claim in that first step.

Residual-based cointegration testing also requires a different reference distribution from an ordinary unit-root test on an observed series. The residual was constructed using estimated long-run coefficients. Applying an ordinary DF critical value directly to that estimated residual can overstate evidence for cointegration.

Deterministic terms, sample size, lag augmentation, and the number of variables affect the test specification. Use an implementation that documents the relevant cointegration test and retain its settings. The core laboratory deliberately avoids claiming a cointegration-test p-value from its plain residual regression. It constructs cointegration by design, then studies estimation and adjustment behavior.

For an applied case, examine whether each level plausibly has the required integration behavior and whether the proposed spread is stable. Investigate breaks in the economic relation and data definitions. Do not infer a stable equilibrium merely because a single test rejects in one conveniently selected window.

A vector error-correction representation

A VAR in levels can be rewritten

ΔYt=ΠYt−1+∑j=1p−1ΓjΔYt−j+ut.\Delta Y_t=\Pi Y_{t-1} +\sum_{j=1}^{p-1}\Gamma_j\Delta Y_{t-j}+u_t.

For rank rr with 0<r<m0<r<m, write Π=αβ′\Pi=\alpha\beta'. Columns of β\beta describe rr cointegrating combinations; columns of α\alpha describe how variables adjust to them. The factorization has normalizations because αβ′\alpha\beta' is unchanged by appropriate invertible transformations of those factors.

This connects multivariate dynamics to the common-trend restriction. Full-rank Π\Pi corresponds to a stationary level system in the appropriate setting; zero rank removes the error-correction term. Determining rank and estimating a full Johansen system requires additional material. The core course stays with a transparent bivariate relation and uses the matrix form to explain what a system extension would add.

Forecast changes and return to levels

An ECM forecast combines the current equilibrium deviation, lagged changes, and admissible forecasts of future inputs. In the simple constructed model, if E[ΔXt+1∣It]=0\mathbb E[\Delta X_{t+1}\mid\mathcal I_t]=0,

ΔY^t+1∣t=αZ^t,Y^t+1∣t=Yt+αZ^t.\widehat{\Delta Y}_{t+1|t}=\alpha\widehat Z_t, \qquad \widehat Y_{t+1|t}=Y_t+\alpha\widehat Z_t.

Using realized future ΔX\Delta X supplies a conditional retrospective calculation, not an unconditional origin-time forecast. Forecast the input, specify a scenario, or model the system jointly. Uncertainty in the long-run relation and input forecast contributes to predictive uncertainty.

A forecast in changes must be evaluated in the correct target units. If the decision concerns the price level, reconstruct the level from the known current price. A model can predict changes modestly while still improving an economically important spread or level forecast; define the loss accordingly.

Two simulated integrated levels share a stationary spread by construction. This design supplies the truth; empirical cointegration requires investigation.

Two simulated integrated levels share a stationary spread by construction. This design supplies the truth; empirical cointegration requires investigation.

Execute and test the adjustment mechanism

Run ch11. The common trend is a simulated random walk; the true slope is 1.5; the spread follows an AR(1) with coefficient 0.5. Thus the generating adjustment coefficient is −0.5-0.5. The shared realization estimates the long-run slope near 1.503 and adjustment near −0.506-0.506.

Inspect the fitted spread, its variance, and its lag-one persistence. Compare the ECM’s residuals with those of a regression in changes that omits the equilibrium error. The latter discards an available predictive component in this constructed setting. Verify that the lagged spread is paired with the subsequent change, not with a change that precedes it.

Break the system by replacing the stationary spread with a second independent random walk. The resulting level relation no longer has the same constructed equilibrium. A finite sample may still look suggestive. Repeat the experiment and use the appropriate inferential framework before asserting a long-run relation. Repair the claim by narrowing it to the supported joint behavior or changing the model after documented evidence.

Worked problem and revision decision

Let the equilibrium relation be Y=2XY=2X, and suppose Yt=110Y_t=110, Xt=50X_t=50, and α=−0.25\alpha=-0.25. The deviation is 10. If the expected next change in XX is zero, the predicted change in YY is −2.5-2.5 and the predicted level is 107.5. If expected ΔX\Delta X is 3 and its short-run coefficient is 1.5, predicted change becomes −2.5+4.5=2-2.5+4.5=2, giving level 112.

The long-run coefficient 2 and short-run coefficient 1.5 answer different questions. A ledger that records only “the effect of X is 2” suppresses that distinction. Record the equilibrium definition, adjustment rule, input forecast, and the loss relevant to the decision.

Project 3 begins with a later data release. If the release challenges a claimed long-run relation, the response can be to revise the relation, retain a simpler procedure, or retire the model. Evidence that a historical spread was stable does not guarantee its future stability.

Sources

Engle and Granger (1987) develop cointegration and error-correction representations. Statsmodels’ VECM documentation describes the matrix form and deterministic-term conventions.

Lecture 12

Predictable risk with an unpredictable return

Can tomorrow's risk be predictable when tomorrow's return is not?

The conditional mean and conditional variance can behave differently

Let a return be Rt=μt+utR_t=\mu_t+u_t, with E[ut∣It−1]=0\mathbb E[u_t\mid\mathcal I_{t-1}]=0. Zero predictable mean does not imply constant risk. Write

ut=htzt,E[zt∣It−1]=0,E[zt2∣It−1]=1.u_t=\sqrt{h_t}z_t,\qquad \mathbb E[z_t\mid\mathcal I_{t-1}]=0,\qquad \mathbb E[z_t^2\mid\mathcal I_{t-1}]=1.

Then ht=Var⁡(ut∣It−1)h_t=\operatorname{Var}(u_t\mid\mathcal I_{t-1}). It is known at the forecast origin under the specified variance recursion, while the next standardized shock is not. A sequence can have little autocorrelation in returns and appreciable dependence in squared returns.

Financial returns provide a familiar application, but the distinction also matters for economic quantities whose uncertainty changes across seasons, regimes, or measurement systems. A larger mean model does not automatically explain conditional variance dynamics.

Before estimating volatility, define the return. A decimal return of 0.01 is a one-percent return; a percentage-point return of 1 represents the same change on a different numerical scale. Log returns and simple returns are also different transformations. State the definition and use it consistently in means, variances, and risk thresholds.

ARCH and GARCH recursions

An ARCH(1) variance is ht=ω+αut−12h_t=\omega+\alpha u_{t-1}^2. A GARCH(1,1) adds lagged variance:

ht=ω+αut−12+βht−1.h_t=\omega+\alpha u_{t-1}^2+\beta h_{t-1}.

Sufficient elementary restrictions for positive conditional variance are ω>0\omega>0, α≥0\alpha\ge0, and β≥0\beta\ge0. For a finite unconditional second moment in the standard model, impose α+β<1\alpha+\beta<1. Strict stationarity can have a different condition involving an expected log; the finite-variance restriction used here is stronger than some stationarity conditions and should be named accurately.

The units agree: hh, u2u^2, and ω\omega have squared return units; α\alpha and β\beta are dimensionless. The lagged squared error updates risk after a large realized surprise, while the lagged variance carries previously assessed risk forward.

Taking expectations under a finite stationary second moment gives

h‾=ω+(α+β)h‾,h‾=ω1−α−β.\overline h=\omega+(\alpha+\beta)\overline h, \qquad \overline h=\frac{\omega}{1-\alpha-\beta}.

As α+β\alpha+\beta approaches one with fixed ω\omega, unconditional variance increases. At the boundary, that finite-variance formula no longer applies. A routine that reports a negative unconditional variance for an inadmissible parameter set has failed a basic domain check.

Forecast conditional variance

At date tt, after observing utu_t, the one-step variance forecast is

ht+1∣t=ω+αut2+βht.h_{t+1|t}=\omega+\alpha u_t^2+\beta h_t.

For later horizons, use E[ut+j2∣It]=ht+j∣t\mathbb E[u_{t+j}^2\mid\mathcal I_t]=h_{t+j|t} under the model. This yields

ht+k∣t=h‾+(α+β)k−1(ht+1∣t−h‾),k≥1.h_{t+k|t}=\overline h+(\alpha+\beta)^{k-1}(h_{t+1|t}-\overline h),\qquad k\ge1.

Variance reverts toward its long-run level at persistence α+β\alpha+\beta. At k=1k=1, the exponent is zero and the expression returns the known one-step forecast. If α=β=0\alpha=\beta=0, risk is constant at ω\omega.

Variance of a multi-period cumulative return is the sum of the conditional variance forecasts when the mean-adjusted returns form the required martingale-difference sequence and cross-covariances vanish. The square-root-of-time rule requires constant per-period variance and the appropriate independence or orthogonality assumptions. Applying it mechanically during changing volatility can misstate multi-period risk.

Estimate a declared objective

Under conditional Gaussianity, the negative log-likelihood apart from constants is

Q(θ)=12∑t[log⁡ht(θ)+ut2ht(θ)].Q(\theta)=\frac12\sum_t\left[\log h_t(\theta)+\frac{u_t^2}{h_t(\theta)}\right].

The supplied code minimizes the average expression without the factor one-half over a declared admissible grid. Multiplying an objective by a positive constant does not change its minimizer. The grid estimator is coarse and transparent; it is not a substitute for a carefully checked continuous optimizer when precise estimation is required.

Under suitable conditions, Gaussian quasi-likelihood can estimate variance parameters without exactly Gaussian innovations. Standard errors then require the appropriate robust treatment. The core grid example supplies no maximum-likelihood standard errors and makes no inferential claim based on a Hessian it has not computed.

The variance recursion is initialized at its candidate unconditional variance. Alternative backcasts or initial values can change short-sample objectives. Retain the initial rule, estimation dates, mean-model treatment, convergence diagnostics, and parameter restrictions when comparing package outputs.

A risk quantile needs a distribution

If zt+1z_{t+1} is standard normal and the conditional mean is μt+1\mu_{t+1}, the conditional return quantile is

qp=μt+1+ht+1∣t Φ−1(p).q_p=\mu_{t+1}+\sqrt{h_{t+1|t}}\,\Phi^{-1}(p).

For p=0.05p=0.05, the standard-normal multiplier is approximately −1.645-1.645. A variance forecast alone does not establish that tail quantile. Heavy-tailed or asymmetric standardized shocks require a different distributional model or a justified empirical quantile procedure.

Value at Risk needs a sign and loss convention. A negative return quantile can correspond to a positive loss threshold. Define whether the reported object is a return, a dollar loss, or a portfolio loss; identify the horizon and confidence level. Expected shortfall is a different tail summary and cannot be inferred by merely renaming the same quantile.

Evaluate risk forecasts using actual subsequent outcomes. Count and date threshold exceedances; inspect clustering as well as their overall frequency. A model can have the desired average exception rate while failing during the periods when risk decisions matter most. Repeatedly changing a threshold after inspecting its exceptions invalidates a clean later-target comparison.

Scaling is an exact audit

If returns are rescaled as ut∗=autu_t^*=a u_t, an equivalent variance model has

ht∗=a2ht,ω∗=a2ω,α∗=α,β∗=β.h_t^*=a^2h_t,\qquad \omega^*=a^2\omega,\qquad \alpha^*=\alpha,\quad\beta^*=\beta.

Moving from percentage-point returns to decimal returns sets a=0.01a=0.01, so variance and ω\omega divide by 10,000. Standard deviations and quantiles divide by 100. A failure of these transformations reveals a units error independent of whether the model fits well.

The code tests this identity directly using the same residuals and parameters. It also deliberately presents an inadmissible parameter set with α+β>1\alpha+\beta>1 and checks that the finite-variance routine rejects it. These tests establish computational invariants. They do not establish that the fitted variance model describes real financial markets.

Simulated returns and their generating conditional variance. Return surprises can be unpredictable while risk varies.

Simulated returns and their generating conditional variance. Return surprises can be unpredictable while risk varies.

Execute, break, and repair

Run ch12. The synthetic process has ω=0.1\omega=0.1, α=0.1\alpha=0.1, and β=0.8\beta=0.8, giving unconditional variance one. The declared coarse grid selects (0.2,0.1,0.7)(0.2,0.1,0.7) on this realization. Including the true parameters in a finite-sample grid does not guarantee that they will minimize the realized objective.

The squared-return lag-one correlation is around 0.151, while the squared standardized-residual correlation is around 0.012. This is consistent with the fitted variance recursion removing much of the visible clustering in the chosen realization. Inspect additional lags and tail behavior before treating that diagnostic as a complete verdict.

Break the risk calculation by using hth_t in place of ht+1∣th_{t+1|t} after the latest residual has arrived. The mistake ignores the newest variance update. Repair it with the one-step recursion and compare the threshold. Then divide returns by 100 without rescaling ω\omega; identify the resulting units inconsistency and correct it.

Worked risk forecast and audit repair

Let ω=0.2\omega=0.2, α=0.1\alpha=0.1, β=0.8\beta=0.8, current variance ht=2h_t=2, and current residual ut=3u_t=3 in percentage points. Next variance is 0.2+0.1(9)+0.8(2)=2.70.2+0.1(9)+0.8(2)=2.7, and next standard deviation is 2.7≈1.643\sqrt{2.7}\approx1.643 percentage points. Under a zero-mean normal specification, the 5% return quantile is approximately −2.703-2.703 percentage points.

Long-run variance is 0.2/(1−0.9)=20.2/(1-0.9)=2. The two-step variance forecast is 2+0.9(2.7−2)=2.632+0.9(2.7-2)=2.63. The model expects risk to decline gradually from the elevated current forecast. With decimal-return units, next variance is 0.00027 and the quantile is approximately −0.02703-0.02703.

Project 2’s repair can address a variance error without changing the entire mean model. Show which risk decision changes and which assumptions remain unresolved. Project 3 should evaluate the repaired procedure on later outcomes, preserving the loss and threshold rules chosen before the continuation data are examined.

Sources

Bollerslev (1986) introduces GARCH. The arch package’s official volatility-model documentation describes mean, variance, and distribution components.

Lecture 13

When the model or the measurement changes

What evidence should make a forecaster stop using a model?

A model’s usefulness has a date

A forecasting procedure can be appropriate for one period and unreliable later. The underlying economic relation can change, the measurement instrument can change, or the decision can change. These are different reasons to revisit the procedure.

An expanding window uses a fixed starting date and accumulates observations. If a stable model is correct, more observations can improve estimation precision. If older observations describe a different regime, that same accumulation can anchor estimates to an obsolete relation. A rolling window discards older information, allowing faster adaptation at the cost of fewer observations and greater estimation variation.

Neither window is universally preferable. Their comparison concerns the tradeoff between sampling precision and relevance of past data. That tradeoff depends on the rate and form of change, the available sample, the model, and the decision loss.

Record an intended review schedule and an evidence-based retirement rule before deployment. Examples include an unrecoverable target-definition change, repeated forecast failures, sustained benchmark underperformance of economically meaningful size, or an identified input becoming unavailable. A model should not survive only because its original report was persuasive.

Write a break into the mechanism

The controlled experiment uses

Yt=ϕtYt−1+εt,ϕt={0.8,t<300,−0.4,t≥300.Y_t=\phi_tY_{t-1}+\varepsilon_t, \qquad \phi_t=\begin{cases}0.8,&t<300,\\-0.4,&t\ge300.\end{cases}

The first regime has positive persistence; the second has alternating, quickly decaying dependence. The change is known to the experiment’s designer. The forecasting procedures do not receive the generating coefficients; they fit their declared windows at each origin.

In an empirical application, a break date may be uncertain. Selecting a date after inspecting the entire sample adds selection uncertainty and changes the inferential question. A historical break analysis and a sequential detector answer different questions: the former can use later observations to locate past change, while the latter must decide when change has become detectable.

This lecture does not treat a retrospective chosen date as a real-time detection result. It asks a narrower controlled question: how do two already specified estimation procedures behave after a change in the generating dynamics?

Bias and variance in a moving environment

In a stable AR process, a long window contains many relevant transitions. After a break, an expanding estimator mixes transitions generated by two different coefficients. Its fitted coefficient can converge toward a weighted compromise over the observation mix rather than the current regime’s coefficient.

A rolling estimator eventually contains only current-regime transitions, provided its window is shorter than the elapsed time since the break. Immediately after the break, however, it also contains old observations. The shorter window can react faster while remaining noisy. It may overreact to a run of unusual innovations even when no regime has changed.

The forecast consequences depend on the current level. A coefficient error multiplied by a large current deviation can create a large prediction error. A small coefficient change can matter economically when the action has asymmetric costs. Report loss in the action’s relevant units rather than treating coefficient stability as the only criterion.

Compare the same post-change targets

The source compares an expanding AR(1) and an AR(1) fitted on the most recent 80 observations. Both refit each period and forecast the same subsequent targets. Evaluation begins after 330 observations, so the design gives the procedures an initial post-break adaptation period. It does not measure their performance on the first surprise at the break itself.

That choice must be disclosed. A decision maker concerned with immediate disruption would also examine the transition targets and the first detection delay. A decision maker concerned with ongoing operation after the disruption could reasonably study the later window. The evaluation dates determine which question the reported losses answer.

For squared loss, retain paired differences

dt=erolling,t2−eexpanding,t2.d_t=e_{\mathrm{rolling},t}^2-e_{\mathrm{expanding},t}^2.

Their mean describes the realized advantage of the rolling procedure on those targets. Dependence in dtd_t complicates a standard error. The code also groups consecutive differences into non-overlapping blocks of ten and calculates the standard error of block means. This is a descriptive dependence-aware approximation at a short sample, not an automatic valid test under every break process. Lecture 4’s frameworks clarify why. The Giacomini–White framework supports normal or chi-squared inference for methods estimated on rolling windows of fixed length, but the expanding procedure here falls outside it. The Diebold–Mariano and West results assume a covariance-stationary loss differential, and a break that keeps moving the expanding estimate violates that assumption. The block and HAC standard errors therefore remain descriptive for this comparison.

Vary the block length and report sensitivity. Longer blocks can better retain dependence while providing fewer effective blocks. A narrow uncertainty estimate based on a single convenient block length should not decide a major model replacement by itself.

A measurement break can imitate an economic break

Suppose the economic state StS_t is stable but the indicator changes from Yt=St+νtY_t=S_t+\nu_t to Yt=a+bSt+νtY_t=a+bS_t+\nu_t. A fitted autoregression can appear to change even though the latent economic dynamics have not. A new scale alters coefficients and forecast units; a new offset changes the mean; changing measurement noise changes apparent persistence.

Investigate metadata before changing the dynamics. Did geographic boundaries change? Did the provider redefine a sector? Did missing observations become zeros? Did the weighting scheme or seasonal adjustment change? An economic explanation and a measurement explanation can require very different repairs.

A documented conversion or crosswalk may restore comparability. A genuinely new economic regime may require a new model. If the old and new target cannot be reconciled, retire the historical series for the original task and define a new target. Extending a line through an incompatible definition does not create continuity.

Provider discontinuation is another operational issue. A model depending on a retired indicator cannot keep producing the same forecast without a substitute information source. An alternative measure needs its own validation; replacing a missing column with a similarly named series can change the economic construct.

Separate monitoring from repeated model selection

A monitoring system records performance, input availability, and model failures as outcomes arrive. A replacement process defines candidate repairs and evaluates them on an appropriate later boundary. If every surprising observation leads to a new model selected on all recent errors, apparent improvements can reflect repeated adaptation to noise.

Retain model versions and the dates their rules became active. Preserve the predictions actually issued. Recomputing historical predictions after every revision creates a revised backtest, not a record of deployment performance. The argument ledger should keep both the old decision and the new reasoning.

A practical review can produce three defensible actions: retain the current procedure, revise a specified component, or retire it and use a fallback. “Retain” is a substantive conclusion when the proposed repair lacks reliable benefit. “Retire” is appropriate when the target or information assumptions no longer support use.

A designed persistence change, with its date known to the simulator. This figure is not a real-time break detector.

A designed persistence change, with its date known to the simulator. This figure is not a real-time break detector.

Execute, break, and repair

Run ch13. The shared realization estimates early persistence near 0.776 and late persistence near −0.372-0.372, reflecting the designed change. On the stated later targets, the rolling procedure has RMSE around 1.055 and the expanding procedure around 1.430. The paired loss difference favors the rolling procedure in this setting.

Now remove the break by keeping the generating coefficient at 0.8 throughout. Compare the same two window rules without changing the evaluation dates. The rolling procedure’s advantage need not remain. This is the essential negative control: a repair tailored to change can sacrifice precision when the process is stable.

Next move the break date and change its magnitude. Retain a small declared grid of sample sizes and window lengths. Record replication means and Monte Carlo uncertainty, including cases in which the ranking reverses. A course experiment should expose the conditions under which an argument fails, not only the example in which it succeeds.

Worked review decision

A deployed model’s mean monthly cost is 100 units over the review window, and a proposed repair has cost 97 on exactly the same targets. The numerical improvement is three units. If implementation costs are ten units per month, replacement is unattractive under that simple cost accounting even before statistical uncertainty is considered.

If the existing model’s required input disappears, the decision changes: its nominal historic accuracy does not restore feasibility. A less accurate but available fallback may become the defensible action. The ledger should identify feasibility and cost as separate dimensions.

For Project 3’s prototype, state which assumption the later release challenges and which repair addresses it. A revised pipeline should change only the components justified by evidence, preserving the comparison needed to assess the repair. Freeze that procedure before the continuation outcomes are examined.

Further reading

Forecasting: Principles and Practice on evaluation supplies the comparison framework. Provider-specific changes should be verified against the original dataset’s documentation rather than inferred from its graph alone.

Lecture 14

Freeze a revision before its next test

Would the revised procedure still look good on an outcome it has not helped select?

Revision is a new empirical argument

Project 1 built a forecasting procedure. Project 2 investigated its assumptions and implementation. Project 3 uses a later release to decide whether to retain, revise, or retire that procedure. The final comparison must distinguish evidence used to propose the repair from evidence used to evaluate it.

Divide the sequence into development data, a later repair period, and a continuation period. Development establishes candidate methods and conventions. The repair period can reveal failures and motivate changes. The continuation period evaluates the frozen revised procedure. Once continuation outcomes influence another selection, they are no longer an untouched continuation test for that revised procedure.

This is a temporal separation, not a magic guarantee. A continuation period can be short or unrepresentative. Future conditions can change again. The design makes the evidence easier to interpret by preserving a clear boundary between choosing a method and assessing its next use.

Freeze the procedure, including its update rule

A freeze records the target, availability rule, transformations, candidate family, selected tuning values, estimation window, update schedule, fallback behavior, loss, and evaluation dates. It also records code and data hashes. Another analyst should be able to execute the same rule without guessing what the author intended.

A frozen procedure can still refit coefficients as new observations arrive if its update rule was declared before the continuation test. Freezing an algorithm is different from fixing every numeric coefficient forever. The distinction must be explicit: a rolling-window AR that refits monthly is a fixed procedure with changing fitted parameters.

For the course’s continuation exercise, future outcomes may enter training only after their declared availability date. The refitting rule cannot use them earlier. A continuation forecast should be reproducible from the information snapshot at its origin, even after later outcomes have arrived.

Fallback rules also belong in the freeze. If rank failure, missing inputs, or nonfinite output prevents a model forecast, use the declared benchmark or abstain according to the task. Retain a failure flag. A method that succeeds only when difficult targets are omitted should not receive an inflated performance score.

Selection, evaluation, and repeated choices

Suppose three window lengths are compared on validation targets. Choose one using the declared loss and a declared tie rule. The minimum validation loss is optimistically selected from noisy alternatives; it is not an unbiased estimate of the chosen procedure’s future performance.

Evaluate the retained window on the later continuation targets. Keep the benchmark and target set fixed. If the continuation ranking differs from validation, report the difference. Do not return to the candidate table and select the window that would have won the continuation period while labeling the result as the original forecast.

There is no universal number of model comparisons that makes a test invalid. The important issue is what information shaped the choice. Record the candidate list and its expansion history. A broad exploratory search can be useful, but its winning backtest needs a new assessment boundary.

Reproduce the data as well as the model

A reproducibility bundle should include a data dictionary, provider links, retrieval date, fixed input files or lawful retrieval instructions, transformation rules, executable source, environment requirements, outputs, and verification results. A seed alone cannot reproduce data downloaded from a changing endpoint.

For this book, synthetic fixtures have a documented generator and file hash. The observed Texas extract has provider-file hashes, output hash, units, selection rules, and vintage limitations. The complete project can run from those frozen files without contacting an API.

The recorded temperature is a statewide monthly mean, and its nonlinear transforms are proxies for heating and cooling exposure. Reproducibility cannot repair a construct mismatch; it makes the mismatch visible so it can be investigated. A perfectly reproduced incorrect target remains incorrect.

Cross-language agreement supplies another audit layer. The R, Julia, and Python implementations share inputs and conventions, then compare numerical quantities. Agreement can expose indexing or sign mistakes in one implementation. It cannot prove a maintained economic assumption shared by all three. Preserve analytic identities and deliberately broken cases alongside parity checks.

Write a decision memo with a bounded claim

Begin the memo with the action justified by the evidence: retain the benchmark, adopt a stated repair, or retire the model. Then name the target and information rule, the audit finding, the repair, and its continuation result. State the practical consequence in the relevant loss units.

An effective memo distinguishes observations from assumptions. “The later sample shows higher error in summer” is a data result. “The increase reflects changing cooling technology” is a substantive explanation requiring additional evidence. “We will test a temperature-response revision” is a proposed action. Combining all three into a causal conclusion overstates what the audit establishes.

Report material unresolved issues where they affect the action. A forecast conditioned on assumed weather should be labeled accordingly. A small improvement over a short continuation period should not be presented as durable dominance. A retirement decision can be correct even when an alternative model has not yet been found.

Execute the frozen-window experiment

Run ch14. Its controlled series follows an AR(1) with coefficient 0.65, then experiences a four-unit level shift after observation 300. Candidate windows are 40, 80, and 160. Validation uses the earlier sequence through 300, with forecasts beginning after 240 observations. The shared realization selects window 160.

The selected window is retained for the later continuation comparison. The procedure refits within that window as observations arrive; it does not reconsider the window length using continuation losses. Continuation evaluation begins after 340 observations, yielding 80 one-step targets. The interval between the shift and that evaluation is an adaptation period included in available history, not a claim of performance on the first break outcome.

On the shared realization, the selected procedure’s continuation RMSE is about 1.022 and the naive forecast’s is about 1.039. That modest difference is much smaller than the advantage in Lecture 13’s different break design. A useful book retains both outcomes. A revision argument should not manufacture a dramatic win where the experiment produces only a small one.

Break the boundary and repair the record

Deliberately choose a window using the continuation losses. Compare the resulting minimum with the originally frozen procedure’s loss. The selected minimum can improve mechanically even if none of the candidate methods has become intrinsically better. Label that calculation a retrospective selection exercise.

Repair the evaluation by restoring the earlier selection and keeping the continuation segment untouched by further choice. If you decide a second revision is needed after seeing continuation outcomes, open a new ledger entry and define a subsequent evaluation boundary. Retain the failed or inconclusive first result.

Now mutate every target after a chosen origin. Re-execute that origin’s forecast with its original training snapshot. Its value must remain unchanged. If it changes, inspect preprocessing, imputation, tuning, and cached fitted objects for future dependence. The freeze’s source hash identifies the procedure to audit; the mutation test examines its information restriction.

Worked selection example

Three methods have validation losses 8, 7, and 9, so the declared rule selects the second. Their continuation losses are 10, 12, and 8. The frozen method’s continuation loss is 12. The best retrospective continuation choice has loss 8, but it is the third method, chosen using the test outcomes.

A report claiming “our selection procedure achieved continuation loss 8” is wrong. The actual selection procedure achieved 12. The continuation data may motivate a new proposal, but that proposal needs another evaluation. This distinction survives even if all calculations are correct and all code runs.

Suppose the frozen model’s forecast fails on one target and its declared fallback is seasonal naive. The continuation loss includes that fallback forecast and a failure flag. Removing the row would change the procedure being evaluated. A method’s operational reliability belongs in its result.

Final project deliverables

The final project combines the revised source, freeze record, continuation forecast table, matched benchmark comparison, and individual defense. A team report states the shared procedure. Each individual explains a specific assumption, calculation, repair, and implication without relying on another member to interpret the evidence.

The semester’s outcome is a chain of defensible decisions: a target defined, a model derived and implemented, an audit replicated, a repair frozen, and an action evaluated on later evidence. Lecture 15 tests whether that reasoning transfers when the dataset, units, or economic story changes.

Further reading

QuantEcon and Jupyter Book demonstrate executable teaching and reproducible publishing. Model Cards for Model Reporting motivates explicit documentation of uses and limits.

Lecture 15

Defend a forecast in an unfamiliar setting

Which parts of the argument remain valid when the setting changes?

Begin again with the economic object

An unfamiliar dataset invites familiar software. Resist choosing a model before defining what its output would mean. Ask what decision is being made, which quantity matters, what its units and geography are, when its records become available, and what loss the action creates.

The same observed pattern can support different models under different mechanisms. Persistence can reflect state dynamics, noisy measurement, temporal aggregation, an integrated level, or a shared regional factor. A graph alone does not choose among those explanations. The model’s derivation and maintained assumptions make the distinction explicit.

The final exercise asks you to carry that reasoning into a new setting. You may know every formula in the course and still fail the task by using tomorrow’s observation today, confusing a flow with a stock, or interpreting a predictive link as an intervention effect. Those errors occur before or after estimation; accurate computation does not neutralize them.

Use invariants to find errors quickly

An invariant is a relationship that should survive a declared transformation. If a linear forecasting procedure is implemented consistently, rescaling the outcome by aa should rescale its level forecasts by aa. Forecast variances should scale by a2a^2. Dimensionless persistence parameters should remain equivalent under the corresponding model transformation.

If a fixed-origin procedure uses only the admitted past, changing later observations must leave its earlier forecast unchanged. If a reduced-form VAR is reordered and correctly permuted back, it should represent the same reduced-form prediction. Structural Cholesky interpretations can change under ordering because the identifying restriction changes.

These are different invariants. Reduced-form permutation equivalence does not imply structural-ordering invariance. A smoother intentionally fails a past-state future-mutation test because its stated information set includes later observations. Use an invariant that matches the procedure’s claim.

Rank failure is another quick diagnostic. A regression with two identical columns cannot uniquely estimate two separate coefficients. Detect the redundancy and change the parameterization before presenting estimates. A numerical solver returning one possible coefficient vector does not create separate identification.

Return to the forecast-error decomposition

For a stable linear process with known parameters, forecast uncertainty arises from future innovations. For an AR(1), Vh=σ2∑j=0h−1ϕ2jV_h=\sigma^2\sum_{j=0}^{h-1}\phi^{2j}. For a random walk, Vh=hσ2V_h=h\sigma^2. For a VAR, Vh=∑j=0h−1AjΣ(Aj)′V_h=\sum_{j=0}^{h-1}A^j\Sigma(A^j)'. For a conditional-volatility process, the relevant variance changes with the information at the origin.

Each formula encodes a different mechanism. A stable univariate process has bounded long-horizon process variance. An integrated process accumulates uncertainty. A vector process carries cross-covariances. A GARCH process uses the latest return surprise to update risk. Recognizing the mechanism matters more than memorizing which package command prints an interval.

Estimation uncertainty, predictor uncertainty, measurement uncertainty, and model selection can add further layers. State which layers your calculation addresses. A simple interval with a precise label can be more useful than an elaborate interval whose information and assumptions are unclear.

Choose a repair that addresses the finding

Suppose a model’s errors are biased upward. A mean or intercept correction can be a candidate repair if the bias is stable and its estimated correction is admissible at future origins. If errors remain serially correlated, a dynamic mean or error model can be considered. If squared errors cluster, investigate conditional variance. If the target definition changes, repair the measurement or redefine the task.

If the audit finds future information in a centered regressor, increasing lag order does not remove it. Replace the regressor construction with an admissible one and reevaluate. If the audit finds an unidentified structural interpretation, improving forecast RMSE does not identify the causal effect. Add credible identifying information or narrow the claim.

If a proposed repair has no reliable benefit on later targets, retaining the existing procedure is an evidence-based action. If an input is unavailable or the target has become incompatible with its history, retirement may be necessary even before another model is ready. A decision should follow the actual failure mode.

A regional financial example

Imagine monthly lending activity across two regions, a financial spread, and a weather measure. A planner asks whether a shock in one region raises lending risk in the other. The data may support a forecasting question: does the other region’s history improve a later risk prediction? They may not support the intervention question without additional identification.

Define lending as a flow or stock, specify how the financial spread is constructed, and align release dates. If a spread combines individually integrated prices, investigate a cointegrating relation rather than assuming its stability. If the risk measure is a volatility forecast, use return or residual units coherently. If weather measures regional exposure, state its spatial weights and transformation order.

A small VAR can summarize joint predictive dynamics. A state-space model can distinguish a latent quantity from a noisy indicator under specified measurement assumptions. A conditional variance model can describe time-varying risk. Combining models does not automatically strengthen the argument: every extra component introduces assumptions and a need for data supporting them.

Choose the smallest procedure that answers the defined task defensibly. The result may be a benchmark plus a well-labeled scenario, not a unified model of every variable. This is a substantive modeling choice rather than a lack of ambition.

Execute the final audit battery

Run ch15. It fits a linear AR forecast on a fixed training prefix, rescales the outcome by 100, and checks that dividing the rescaled forecast by 100 recovers the original. It then changes every later observation by 1,000 and verifies that the earlier forecast does not move.

The code compares the analytic horizon-one and horizon-twelve variances of a random walk with innovation variance one: 1 and 12. A zero-persistence AR has variance one at either horizon. Those boundary values distinguish accumulating innovations from independent level observations.

It deliberately supplies a rank-deficient regression and checks that the implementation reports failure. These checks run in all three languages on identical inputs. A language-specific failure indicates an implementation issue; agreement supplies evidence of consistent conventions. The economic assumptions still require your defense.

Extend the battery to your project. Use a test that can actually fail: mutate future targets, change units, create a missing required input, or reverse an asserted link direction. Predict the result before running. If your supposed invariance fails, identify whether the procedure’s claim or the implementation is wrong.

An individual defense

You should be able to explain the project without beginning with software. State the decision and target. Derive the relevant forecast or variance relation. Identify the admitted information. Explain one calculation in the implementation. State the audit finding and why the repair addresses it. Interpret the continuation result and name the action it justifies.

The defense should preserve uncertainty. “The later sample favors the rolling procedure under squared loss” is stronger and more precise than “rolling models are better.” “The identified response depends on a recursive ordering we can justify through timing” is more defensible than “the graph proves transmission.” “The dataset is a fixed latest vintage” identifies what the historical comparison can claim.

When a new fact arrives, revise the argument ledger rather than rewriting its past entries. A record of changing judgments is useful scientific evidence. It reveals which assumptions survived and which predictions changed the decision.

Worked unfamiliar case

A forecaster reports next-quarter total regional spending using a monthly average series, a centered economic index, and a normal interval from a constant-variance regression. What should the audit inspect first?

First verify the target’s aggregation: a quarterly flow total requires an appropriate sum, not a monthly average relabeled as a total. Then inspect the index’s construction and release dates; centering may include future observations. Only after the quantity and information set are correct should the audit interpret the interval’s variance assumption and parameter uncertainty.

Suppose the forecast improves after those repairs but the report also claims that a regional policy intervention caused the improvement. A successful predictive repair does not establish that intervention effect. The causal sentence requires its own identification argument. The final action can be to use the repaired forecast while withholding the unsupported causal interpretation.

What to retain after the course

Keep the derivations, executable examples, and project record as connected tools. The formulas explain what the code should compute. The code makes implications reproducible. Deliberate counterexamples identify the limits of an argument. Later outcomes determine whether a procedure remains useful for its decision.

Keep a project record that another analyst could follow: what you knew, what you predicted, what went wrong, and what you changed. When you revisit the work, that record should explain the decision as clearly as the code reproduces the calculation.

The public practice materials support independent study. Live assessments and grading keys are retained separately by the instructor. The final assessment asks for the same transferable reasoning developed here: a coherent target, an admissible forecast, a correct calculation, an investigated failure, and a defensible action.

Further reading

The ASA GAISE College Report supports contextual investigation and active learning. QuantEcon provides a model of executable quantitative teaching. The book’s methods record documents its teaching references, numerical checks, and data sources.