5 The map
This chapter is the spatial view of the program — every NMTC project that has ever been funded, placed at its 2020-census-tract centroid over real Earth imagery. The static map is below; the interactive viewer is at the bottom of the page.
5.1 Static view: 8,019 projects on the U.S. map
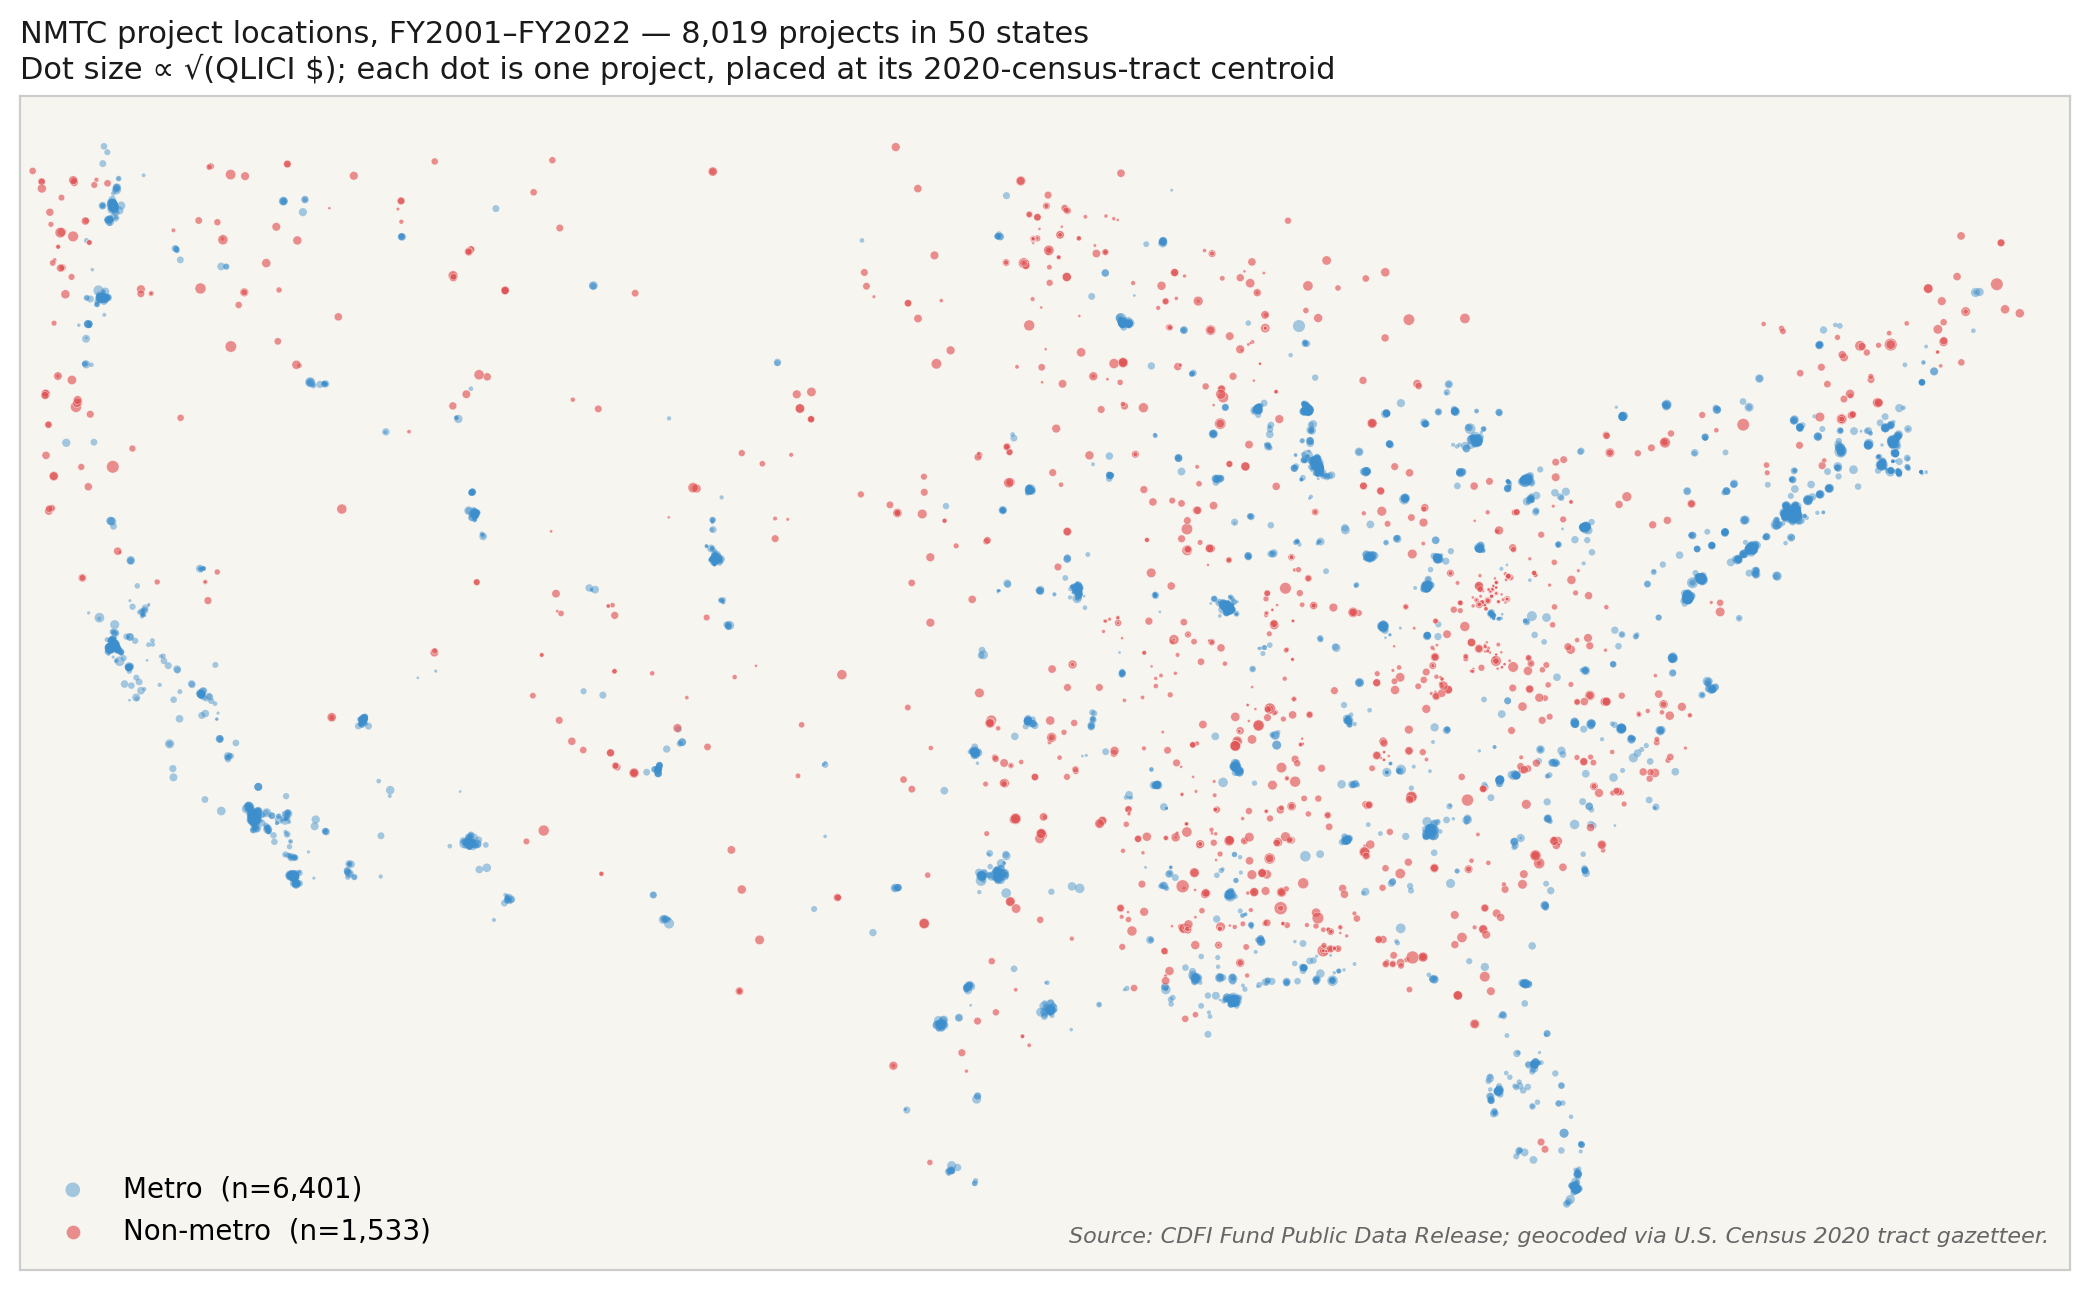
Three things to notice in this map:
Dense metro clustering. The blue mass on the coasts and around major metros (Los Angeles, San Francisco, Chicago, New York, DC, Atlanta, Houston, Dallas, Miami, Boston, Seattle) is unmistakable. NMTC is overwhelmingly an urban program by raw dollar count.
Non-metro presence is real but thin. The red dots are scattered through the rural interior — the Mississippi Delta, Appalachia, the plains states, the Mountain West, rural Maine, the Texas-Oklahoma border. Every state has at least some non-metro deployment.
The 20% statutory mandate has bite at the aggregate level. The non-metro share of dollars is 19.6%, just barely below the floor. But the spatial distribution of those rural dots is wildly uneven — some states (Montana, Maine, Mississippi) over-perform their share; others under-perform sharply.
5.2 Interactive viewer
For year-range filtering, metro toggling, project-type filtering, and project-level hover information over Esri World Imagery, open the interactive Cesium-based viewer:
The viewer renders all 8,019 geocoded projects as filterable Cartesian primitives over a tokenless Esri World Imagery base layer. Year range, metro status, and QALICB-type filters update the rendered set in real time; hover any dot for project-level detail. Source code in viewer/.
5.3 Bunching at the 20% mandate (preview)
A second spatial-distribution diagnostic is the cross-CDE distribution of non-metro deployment shares — does the 20% statutory floor produce visible bunching at s_j = 0.20? See Chapter 6 for the full diagnostic and discussion.